The Product Space and Country Prosperity
As reported in different parts of this website, the group I am currently working in is called “Center for International Development”. The mission of this group, in the words of its head Ricardo Hausmann, is quite trivial and unambitious: to eradicate poverty from the world. Knowing how to do it is far from easy and there are different schools of thought about it. The one that Hausmann chose starts with understanding how production and economic growth work, i.e. why some industries are successful in a country and not in another.
To address this question, Hausmann (together with César A. Hidalgo, Bailey Klinger and Albert-Laslo Barabasi) developed the Product Space. The original idea has been published in this paper in 2007, far before I joined the group, but my (overestimated) expertise was heavily exploited to generate its current implementation (the Atlas of Economic Complexity, a book freely available in electronic format). For this reason I feel no shame in writing a post about it in this blog (and to share the Product Space itself in my Dataset page).
The fundamental assumption of the Product Space is the following: countries are able to have a comparative advantage in exporting a given product because they have the capabilities to export it. In abstract, it means: “I do this, because I can“. Quite reasonable. In pictures, with the awesome “A capability is a piece of LEGO” metaphor created by Hidalgo:
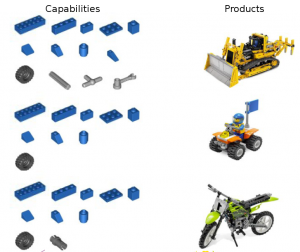
From this assumption, it follows that if a country can export two different products, it is because it has the capabilities to export both. Also this step is quite easy. The conclusion is immediate: a country’s development success is lead by its capabilities. The more capabilities the country has (meaning that its LEGO box is big and it contains a lot of pieces), the more capabilities it will be able to acquire, the faster it will grow.
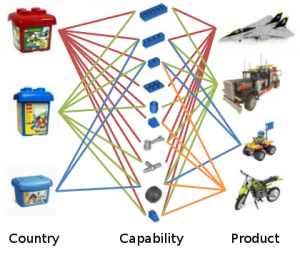
There is a small problem with this conclusion: we can’t observe the capabilities. Of course, if we could then they would be blatantly obvious, so every country could employ its growth strategy based on them. (There is actually another problem: capabilities are tacit knowledge, as Nonaka and Takeuchi would say, so you really can’t teach them, but we will come to this problem later)
What we can observe is simply which countries export what:
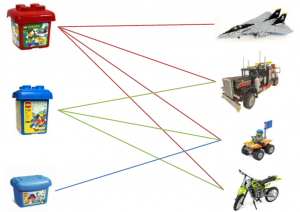
But remember: if two products are exported by the same country, then there may be common capabilities needed for their productions; while if two countries export the same products, then they share at least part of the same capabilities. In mathematical terms, it means that the observed country export picture is actually the multiplication of the two halves of the second picture of the post, or:
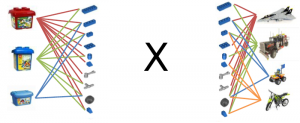
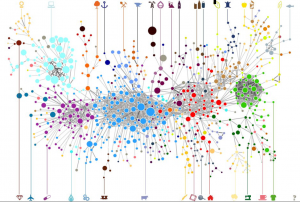
This is nice because it means that we can collapse the country-product relationships into product-product relationships and then mapping which product is related to which other product, because it requires the same capabilities. The advice for countries is then: if you are exporting product x, then you are likely to have most of the capabilities to export all the products that are connected to x. And this is how the Product Space was born, a single picture expressing all these relationships:
(click on the picture for a higher resolution, or just browse the Atlas website, that is also dynamic).
In the picture the nodes are colored according to the community they belong to (for more information about communities, see a previous post). The communities make sense because they group products that intuitively require the same extended set of capabilities: in cyan we have the electronic products, light blue is machinery, green is garments and so on and so forth.
Is the structure of the Product Space telling us something reliable? Yes, countries are way more likely to start export products that are close, in the Product Space, to the products they already export. Also, it is important to know where the export products of a country are in the Product Space. The more present a country is in the denser cores of the Product Space, the more complex it is said to be. This measure of complexity is a better predictor of GDP growth than classical measures used in political economy like average years of schooling.
Is the structure of the Product Space telling us something interesting? Hell yeah, although it’s not nice to hear. The Product Space has communities, so if you export a product belonging to a community then you have a lot of options to expand inside the community. However, many products are outside the communities, and they are very weakly connected with the rest, often through long chains. The meaning? If you are only exporting those products, you are doomed to not grow, because there is no way that you’ll suddenly start exporting products of a community from nothing (because this would require tacit knowledge that you cannot learn and is not close to what you know). And guess what products the poorest countries are currently exporting.
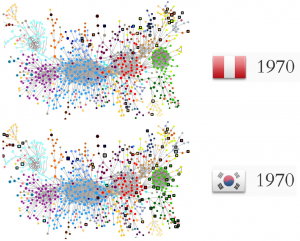
To conclude, a couple of pictures to provide one proof of the reasoning above. In 1970, Peru had more average years of schooling, more land and twice the GDP per capita of South Korea. Traditional political economy would say that Peru was strong and there was no way that South Korea could catch up. Where South Korea is today is evident. What was the difference between the two countries in terms of Product Space?
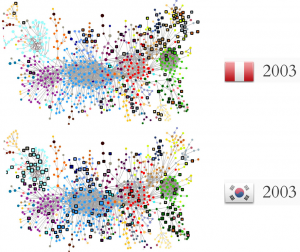
(again, click for higher resolution. The black square border indicates which products the country is exporting). There is not a lot of difference in quantities (and this explains why South Korea was poorer). However, South Korea had those two or three products in a very valuable position, while Peru had only products in the branches: a long way to the core. In 2003, this was the result:
Peru is still mainly on the edges, South Korea occupies the center. And that’s all.
