A Bayesian Framework for Online Social Network Sampling
Analyzing an online social network is hard because there’s no “download” button to get the data. In the best case scenario, you have to query an API (Application Program Interface) system. You have to tell the API which user you want to see the connections of, and you can’t just ask for all users at the same time. With the current API rate limits, downloading the Twitter graph would take seven centuries, as the picture below explains.
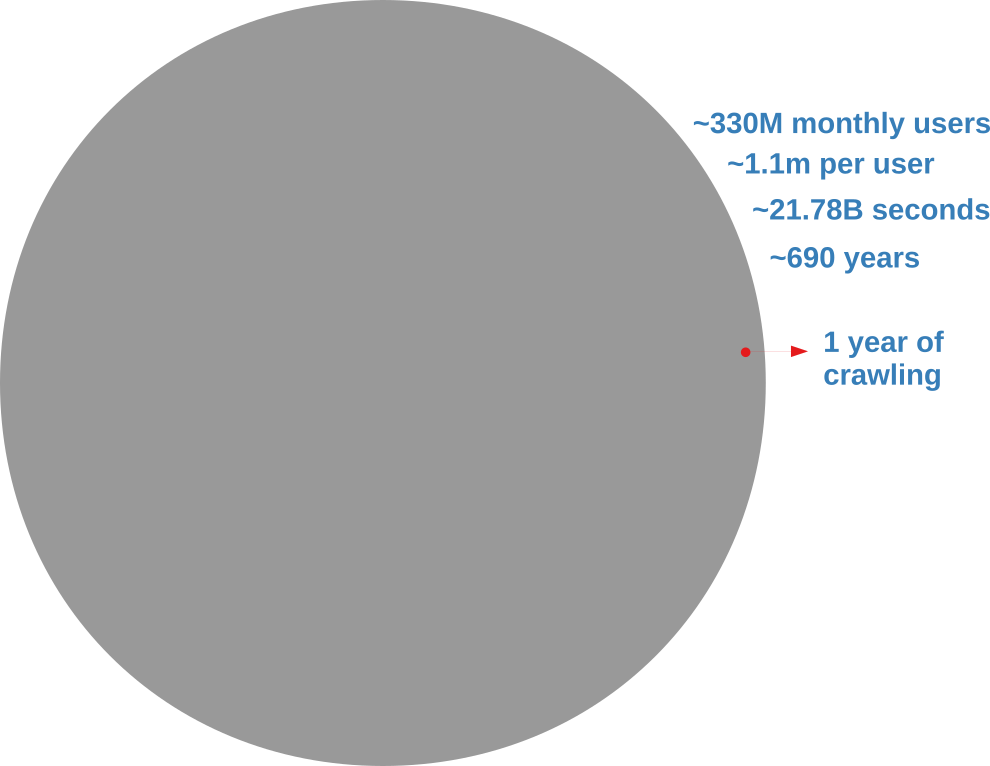
I don’t know about you, but I don’t have seven centuries to publish my papers. I want to become a famous scientist now. If you’re like me, you’re forced to extract only a sample. In this post, I’ll describe a network sampling algorithm that works with social media APIs to maximize the amount of information you get from your sample. The method has been published in the paper “Noise Corrected Sampling of Online Social Networks“, which recently appeared in the journal Transactions on Knowledge Discovery from Data.
My Noise Corrected sampling (NC) is a topological method. This means that you start from one (or more) user IDs that are known, and then you gather new user IDs from their friends, then you move on to the friends’ friends and so on, following the connections in the graph you’re sampling. This is the usual approach, because there is no way to know the user IDs beforehand — unless you have inside knowledge about how the social media platform works.
The underlying common question behind a topological sampler is: how do we pick the best user to explore next? Different samplers answer this question differently. A Random Walk sampler says: “Screw it! Thinking is too hard! I’m gonna get a random node from the friends of the currently explored node! Then, with the time I saved, I’m gonna get some ice cream.” The Metropolis-Hastings Random Walk — the nerd’s answer to the jock’s Random Walk — wants to preserve the degree distribution, so it penalizes high-degree nodes — since they’re more likely to be oversampled. Alternatively, we could use classical graph exploration techniques such as Depth-First and Breadth-First Search — and, again, you can enhance them so that you can preserve some properties of the network, for instance its clustering coefficient.
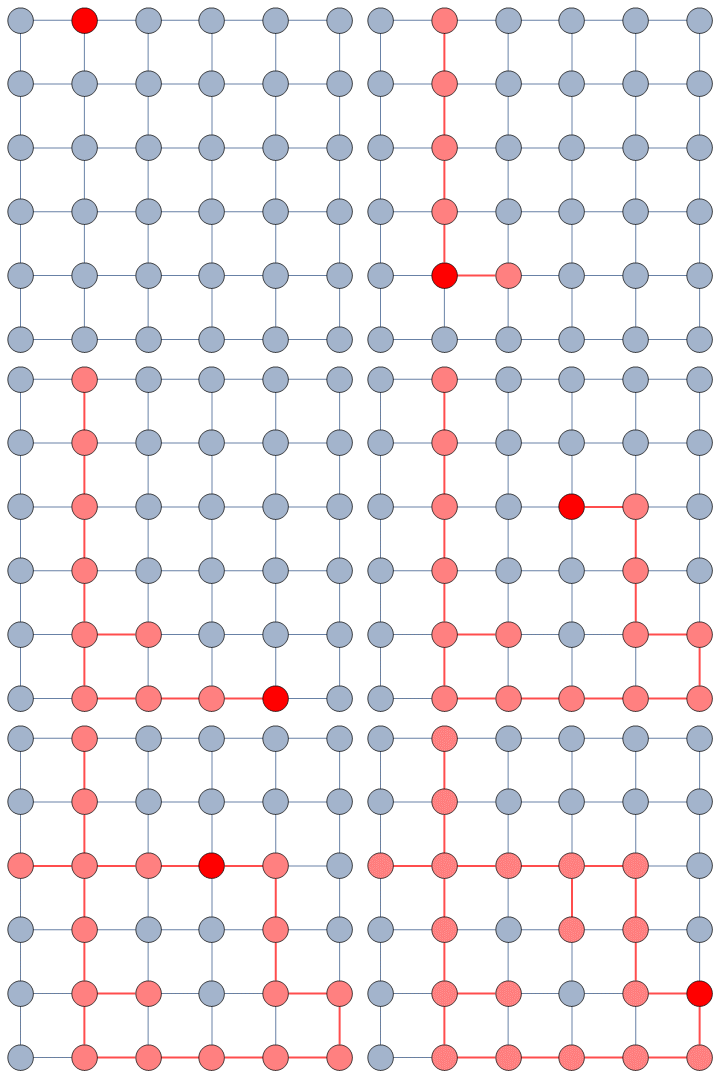
My NC departs from all these approaches in a fundamental way. The thing they all have in common is that they don’t use information from the sample they have currently gathered. They only look at the potential next users and make a decision on whom to explore based on their characteristics alone. For instance Metropolis-Hastings Random Walk checks the user’s popularity in number of connections. NC, instead, looks at the entire collected sample and asks a straightforward question: “which of these next users is most likely to give me the most information about the whole structure, given what I explored so far?”
It does so with a Bayesian framework. The gory math is in the paper, but the underlying philosophy is that you can calculate a z-score for each edge of the network. It tells you how surprising it is that this edge is there. In probability theory, “surprise” is a good thing: it is directly related to how much information something gives you. Probability theorists are a bunch of jolly folks, always happy to discover jacks-in-a-box. If you always pick the most surprising edge in the network to explore the next user, you’re maximizing the amount of information you’re going to get back. The picture below unravels what this entails on a simple example.
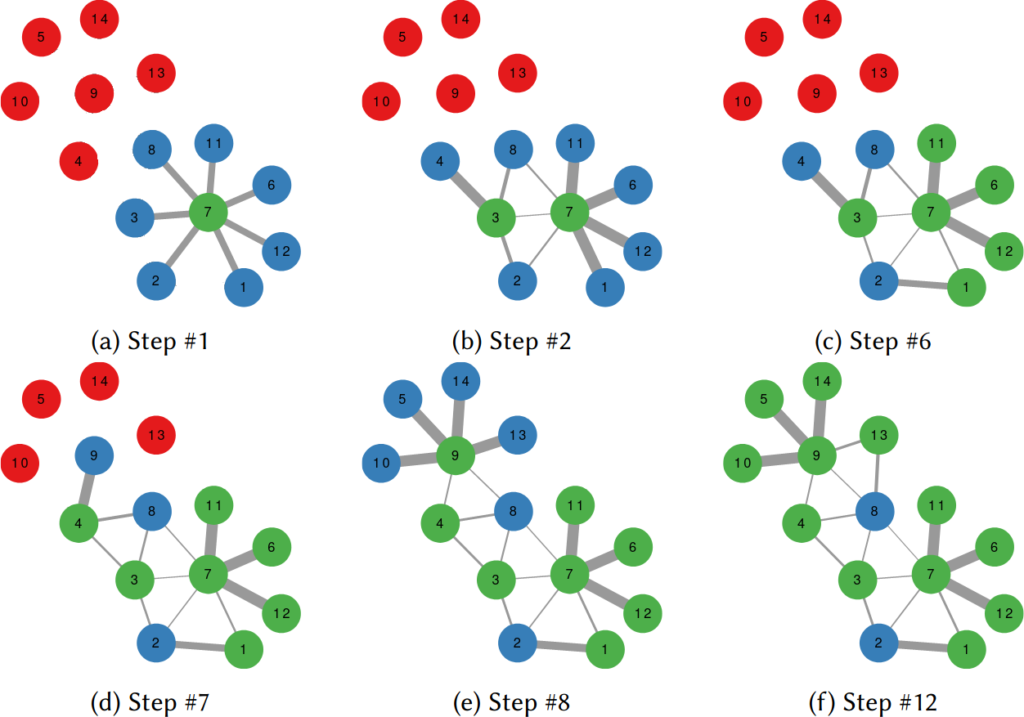
The first figure (a) is the start of the process, where we have a network and we pick a random starting point, node 7. I use the edge thickness to show its z-score: we always follow the widest edge. Initially, you only pick a random edge, because all edges have the same z-score in a star. However, once I pick node 3, all z-scores change as we discover new edges (b). In this case, first we prioritize the star around node 7 (c), then we start following the path from node 3 until node 9 (d-e), then we explore the star around node 9 until there are no more nodes nor edges to discover in this toy network (f). Note how edges exhaust their surprise as you learn more about the neighborhoods of the nodes they connect.
Our toy example is an unweighted network, where all edges have the same weight, but this method thrives if you have information about how strong a connection is. The edge weight is additional information that can be taken into account to measure its surprise value. Under the hood, NC estimates the expected weight of an edge given the average edge weights of the two nodes it connects. In an unweighted network this is equivalent to the degree, because all edges have the same weight. But in a weighted network you actually have meaningful differences between nodes that tend to have strong/weak connections.
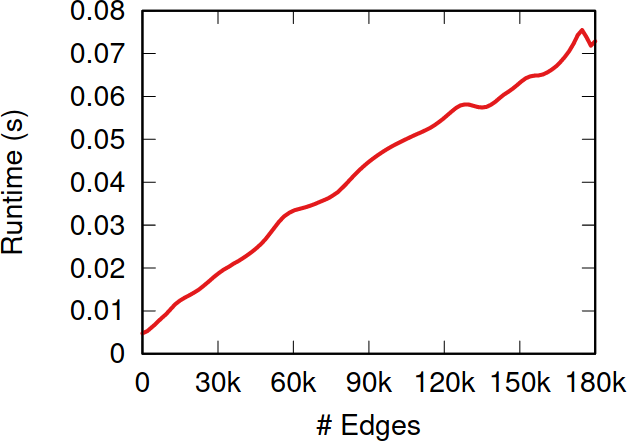
So, the million dollar question: how does NC fare when tested against the alternatives I presented before? The first worry you might have is that it takes too much time to calculate the z-scores. After all, to do so you need to look at the entire sampled network so far, while the other methods only look at a local neighborhood. NC is indeed slower than them—it has to be. But it doesn’t matter. The figure above shows how much time it takes to calculate the z-scores for more and more edges. Those runtimes (less than a tenth of a second) are puny when compared to the multi-second wait times due to the APIs’ rate limits — or even to simple network latency. After all, NC is a simplification of the Noise-Corrected Backbone algorithm I developed with Frank Neffke, and we showed in the original paper that it was pretty darn fast.
What about the quality of the samples? This is a question with a million answers, because it depends on what you want to do with the sample, besides what are the characteristics of the original graph and of the API system you’re wrestling against, and how much time you have to gather your sample. For instance, in the figure below we see that NC is the best method when you want to estimate the assortativity value of a disassortative attribute (think gender in a dating network), but it is a boring middle-of-the-pack method when you want to reconstruct the original communities of a network.
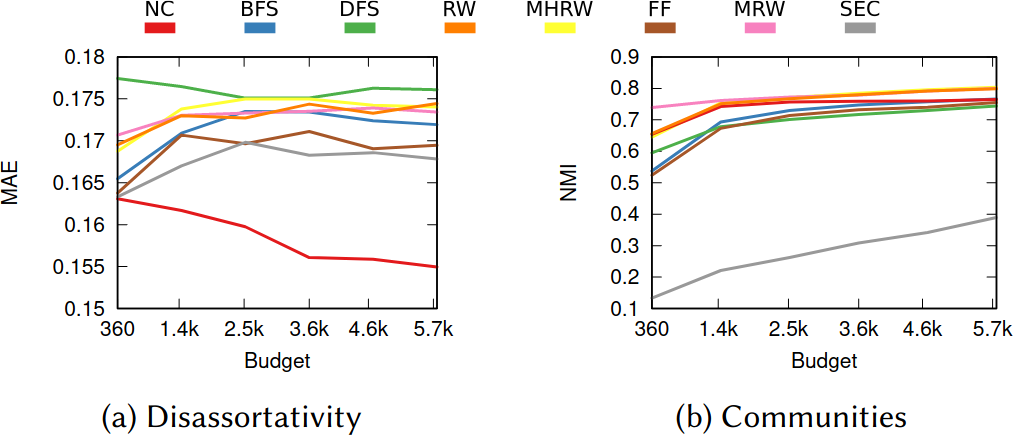
NC ranks between the 3rd and 4th position on average across a wide range of applications, network topologies, API systems, and budget levels. This is good because I test eight alternatives, thus the expectation is that NC will practically always be better than average. Among all eight methods tested, in fact, no other method has a better rank average. The second best method is Depth-First Search, which ranks 4th three out of four times, against NC’s one out of two.
I have shared some code allowing to replicate my results. If you speak Python better than you speak academiquese, you could use that code to infer how to implement an NC sampling strategy next time you need to download Twitter.
