Pearson Correlations for Networks
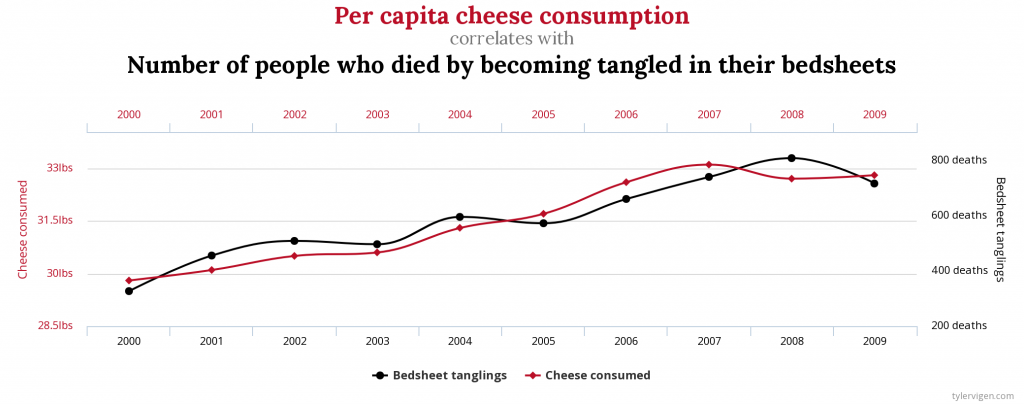
We all know that correlation doesn’t imply causation:

And yet, we calculate correlations all the time. Because knowing when two things correlate is still pretty darn useful. Even if there is no causation link at all. For instance, it’d be great to know whether reading makes you love reading more. Part of the answer could start by correlating the number of books you read with the number of books you want to read.

As a network scientist, you might think that you could calculate correlations of variables attached to the nodes of your network. Unfortunately, you cannot do this, because normal correlation measures assume that nodes do not influence each other — the measures are basically assuming the network doesn’t exist. Well, you couldn’t, until I decided to make a correlation coefficient that works on networks. I describe it in the paper “Pearson Correlations on Complex Networks,” which appeared in the Journal of Complex Networks earlier this week.
The formula you normally use to calculate the correlation between two variables is the Pearson correlation coefficient. What I realized is that this formula is the special case of a more general formula that can be applied to networks.
In Pearson, you compare two vectors, which are just two sequences of numbers. One could be the all the numbers of books that the people in our sample have read, and the other one is all of their ages. In the example, you might expect that older people had more time to read more books. To do so, you check each entry in the two vectors in order: every time you consider a new person, if their age is higher than the average person’s, then also the number of books they read should be higher.
If you are in a network, each entry of these vectors is the value of a node. In our book-reading case, you might have a social network: for each person you know who their friends are. Now you shouldn’t look at each person in isolation, because the numbers of books and the ages of people also correlate in different parts of the network — this is known as homophily. Some older people might be pressured into reading more books by their book-addicted older friends. Thus, leaving out the network might cause us to miss something: that a person’s age tells us not just about the number of books they have read, but it also allows us to predict the number of books their friends have read.

To put it simply, the classical Pearson correlation coefficient assumes that there is a very special network behind the data: a network in which each node is isolated and only connects to itself — see the image above. When we slightly modify the math behind its formula, it can take into account how close two nodes are in the network — for instance, by calculating their shortest path length.
You can interpret the results from this network correlation coefficient the same way you do with the Pearson one. The maximum value of +1 means that there is a perfect positive relation: for every extra year of age you read a certain amount of new books. The minimum of -1 means that there is a perfect negative relationship: a weird world where the oldest people have not read much. The midpoint of 0 means that the two variables have no relation at all.
Is the network correlation coefficient useful? Two answers. First: how dare you, asking me if the stuff I do has any practical application. The nerve of some people. Second: Yes! To begin with, in the paper I build a bunch of artificial cases in which I show how the Pearson coefficient would miss correlations that are actually present in a network. But you’re not here for synthetic data: you’re a data science connoisseur, you want the real deal, actual real world data. Above you can see a line chart, showing the vanilla Pearson (in blue) and the network-flavored (in red) correlations for a social network of book readers as they evolve over time.
The data comes from Anobii, a social network for bibliophiles. The plot is a correlation between number of books read and number of books in the wishlist of a user. These two variables are positively correlated: the more you have read, the more you want to read. However, the Pearson correlation coefficient greatly underestimates the true correlation, at 0.25, while the network correlation is beyond 0.6. This is because bookworms like each other and connect with each other, thus the number of books you have read also correlates with the wishlist size of your friends.
This other beauty of a plot, instead, shows the correlation between the age of a user and the number of tags they used to tag books. What is interesting here is that, for Pearson, there practically isn’t a correlation: the coefficient is almost zero and not statistically significant. Instead, when we consider the network, there is a strong and significant negative correlation at around -0.11. Older users are less inclined to tag the books they read — it’s just a fad kids do these days –, and they are even less inclined if their older friends do not tag either. If you were to hypothesize a link between age and tag activity and all you had was lousy Pearson, you’d miss this relationship. Luckily, you know good ol’ Michele.
If this makes you want to mess around with network correlations, you can do it because all the code I wrote for the paper is open and free to use. Don’t forget to like and subscrib… I mean, cite my paper if you are fed up with the Pearson correlation coefficient and you find it useful to estimate network correlations properly.


