16 June 2013 ~ 0 Comments

NetSci 2013 Report

As I mentioned a couple of months ago, during the first week of June the NetSci conference took place. NetSci is the main venue that brings together all researchers interested and involved in network science. It has always been a gigantic opportunity to put you in contact with the big shots in network analysis and an excellent playground for very interesting discussions. This year was no different.

Of course, for me the most important part of it was the very first day, when the satellite on multiple networks (organized by myself together with Matteo Magnani, Dino Pedreschi, Luca Rossi, Guido Caldarelli and Przemyslaw Kazienko) happened. As I wrote more than once in the past, multiple networks are networks in which the nodes may be connected with different kinds of interactions (friendship, collaboration, and so on).

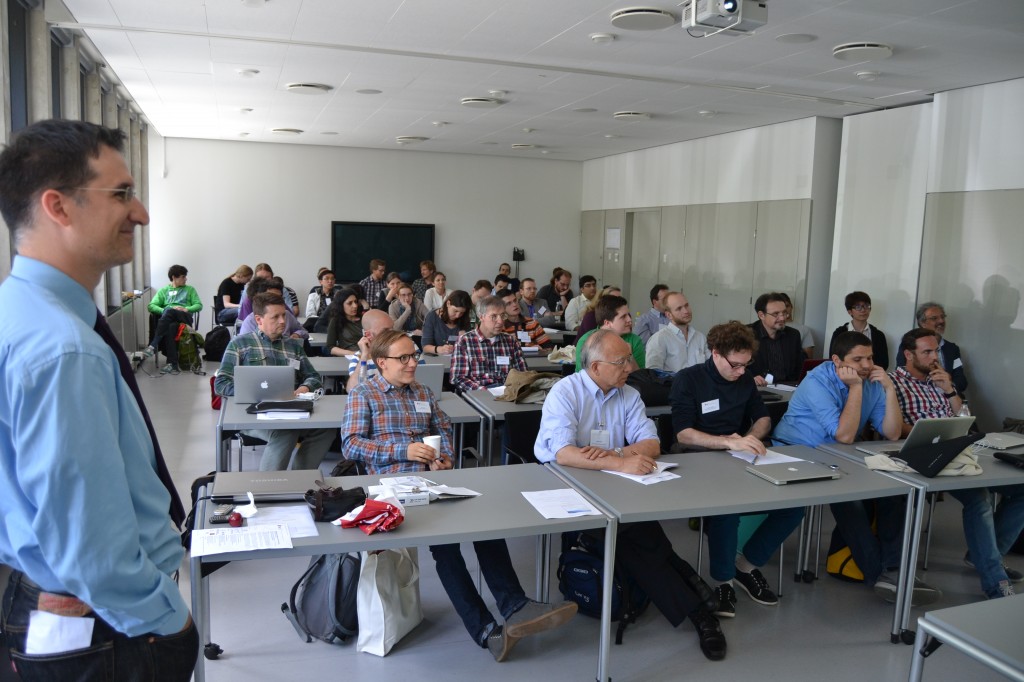
It was an extremely interesting event; a first step to bring together many researchers working on the topic of multiple networks, most of whom hadn’t spoken to each other up until then. And when I say it was a smooth and successful operation, you don’t have to take my word for it. We have proof of a room full of brilliant minds taking up all the available spots… and beyond:
The talks were very impressive:

  • We learnt how to measure eigenvector centrality on multiple networks (and you can too);
  • We learnt how to extend basic measures from regular complex networks to multiple networks (and you can too);
  • We learnt how to mine network with heterogeneous information on nodes and edges (and you can too);
  • We learnt how to detect communities on multiple networks (and you can too);
  • We learnt how to infer the latent structure of inter-related networks (and you can too);
  • We learnt how a random walker behaves on dynamic networks (and you can too);
  • We learnt about the structure and dynamics of multiple networks (and you can too);
  • And we learnt how the properties of multiple networks arise when adding one network at a time (and you can too).

But NetSci, of course, was much more than just this satellite. Another event you absolutely didn’t want to miss there was the Arts, Humanities and Complex Networks Symposium, organized by Max Schich and Isabel Meirelles.

They are both great guys, with a gigantic knowledge about art and design. For example, they picked up a great reference for the logo of their symposium, namely one of the most known infographics made about visual arts, by Alfred Barr:

And besides the usual great lineup of talks (from the Wikidata project to a very cool movie ranking multiple network algorithm) you can learn surprising stuff about basically everything. My favorite: the observation of one of the speakers about the above visualization itself. Apparently, he was the first to realize that there is a bull up there (hint: Cubism lays in between the bull’s horns). As Max then puts it:

Then… the rest of the conference. It is impossible to even give a close idea of the overload of ideas and flashes of genius that populated the venue for those three days. I’ll work around the problem and cheat by giving you a laundry list of (a very tight subset of) the things that most impressed me during the conference:

  • The excellent invited talk by Shlomo Havlin about interdependent networks (networks which depend on each other to function, much like a computer network controlling the electric grid). This interests me because he claims that interdependent networks are a more general case of multiple networks (although I personally have an inkling that perhaps they can be reduced to the same model);
  • The usual spectacular presentation style of my friend Cesàr Hidalgo, who this time talked about a complex system showing a nested structure: namely, the cultural exports of different countries;
  • A really great contributed talk by Esteban Moro, which in my opinion could have been a keynote speech as well. Dr. Moro highlighted how people have a trade-off between social capacity (how many relationships we can keep alive) and social activity (how many new people we can meet). As a consequence, different social strategies arise;
  • A brilliant mathematical formulation of a network problem by Jure Leskovec, that, in my opinion, could be the final word about the problem itself. And it resembles the formal mathematical formulation of the same algorithmic idea behind my DEMON;
  • And the hilarious ignite talks, 5 minutes and 20 slides for each speaker. There was no possibility of interacting, with the presentation automatically jumping to the next slide every 15 seconds. Next year I definitely want to try to do one too.

And, of course, many other things. But you get the idea: blog posts about it are boring, you really have to experience it yourself.


Continue Reading

21 March 2013 ~ 2 Comments

Multidimensional Networks @ NetSci!

This month, I am interrupting the sequence of posts discussing my papers for a shameless self-promotion – after all, this entire website is shameless self-promotion, so I don’t see a problem in what I’m doing. Some months ago, I discussed my work on multidimensional networks, networks that include different kinds of relations at the same time. The whole point of the post was that these are different animals than traditional complex networks, and thus they require new tools and a new mindset.

So I asked myself: “What is the best way to create this new sensibility in the network community?”. I also asked a bunch of other great people, in no particular order: Matteo Magnani, Luca Rossi, Dino Pedreschi, Guido Caldarelli and Przemyslaw Kazienko. The result was the topic of today’s post: a symposium in the 2013 edition of the NetSci conference!

NetSci is a great venue for network people. From their website:

“The conference focuses on interdisciplinary research on networks from various disciplines such as economy, biology, medicine, or sociology, and aims to bring new network analytic methods from physics, computer science, math, or statistics to the attention of a large and diverse audience.”

This year, NetSci will take place in Copenhagen and you should check out a number of reasons for attending. One of those reasons is our symposium, called “Multiple Network Modeling, Analysis and Mining“. You can check important information about attending the symposium in the official event webpage: http://multiplenetworks.netsci2013.net/. Here are the three main highlights:

  • It is an excellent occasion to learn more about multidimensional networks, a model that can help understand the complex interplay between the different relationships we establish every day (friendship, collaboration, club membership, …), better than everything else has been done before;
  • We still have to finalize our speaker list, but it will be of very high quality and will include Jiawei Han, Lei Tang, Renaud Lambiotte and others;
  • Symposium attendance is free! And there will be free food! Woo-hoo! Just sign up in the official Google Doc.

Don’t take my word on the first point and check out the publications we refer to in our webpage. Here, following the above mentioned shameless self-promotion, I’ll list the papers on the subject written by yours truly:

If you find all of this interesting, I definitely hope to see you in Copenhagen this June!

Continue Reading

29 January 2013 ~ 0 Comments

Exploring Classical Archaeology

Science is awesome. It’s awesome to write and to read papers and learning a lot in the process. All this awesomeness comes with a price: the price of popularity. In the last decades, universities and research institutes became better and better in capturing talented people and in multiplying their scientific output. As a result, the number of peer-reviewed conferences and journals exploded, as well as the number of papers itself (the actual numbers are kind of scary). When browsing papers in this open sea of scientific publications, it’s hard to know what is relevant and hopeless to know what is related to what else.

Let’s make an example. Suppose you are back from a holiday in Italy and you are still amazed by the beautiful Greek temples of Paestum. You are a scientist, so you want to read papers (sigh). You go to a bibliographic database. You search for “Paestum” and you get a couple of hundreds works that spans from focused papers on Paestum to publications that mention Paestum by accident. They are sorted more or less by importance, as you would expect from Google Search. There’s not really much that tells you briefly what it is related to Paestum, where Paestum is in the landscape of classical archaeology and which are the sub-fields Paestum is more relevant to.

With this problem in mind, I teamed up with Maximilian Schich, a very bright guy I met when I was a guest researcher at Northeastern University in 2011. Max is an atypical art historian with a strong background in network analysis and he had the problem of finding a way to make sense of 370,000 publications by 88,000 authors collected in the Archäologische Bibliographie, a bibliographic database that collects and classifies literature in classical archaeology since 1956. Every publication is classified using 45,000 different classifications (think of tags describing the content of a paper).

Given our common interest in networks, and the fact that we were sharing a desk with a gigantic window providing inspiring landscapes for several months, we decided to team up and the result was a paper published in a KDD workshop. To solve our quest for Paestum, we created a browsing framework that adds two extra levels to the plain paper search I just described: a global level and a meso-level.

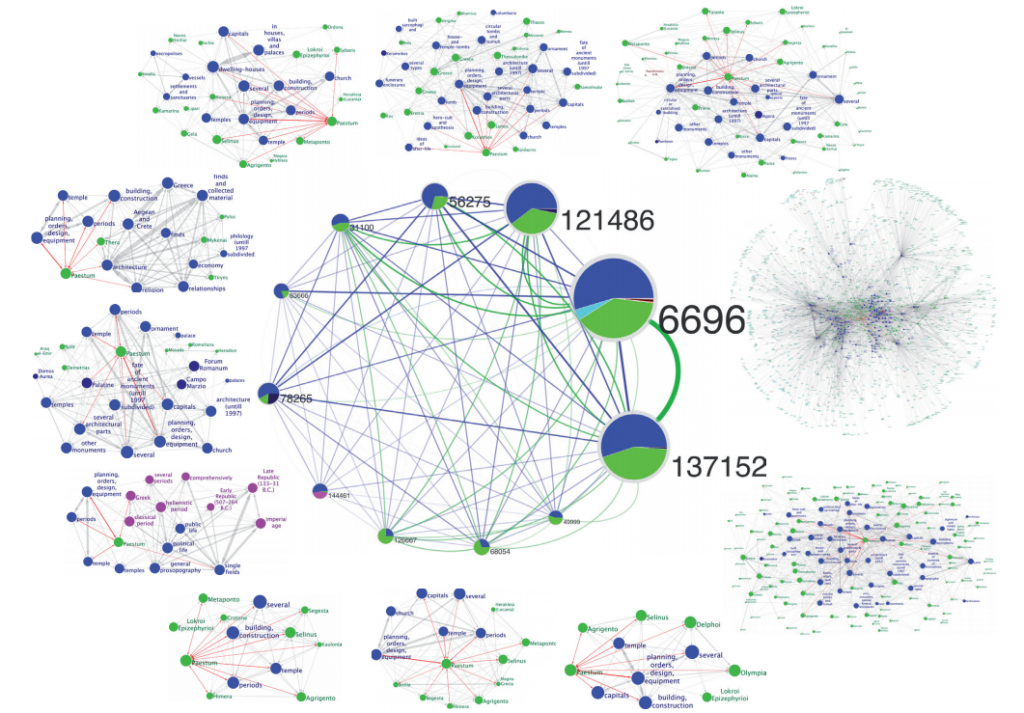
The global level aims at providing a general picture of a field, excluding details but allowing to understand where and how big are the sub-fields composing one field. It will tell us where Paestum is in the landscape of classical archaeology. At the global level, we created a network of classifications by connecting two of them if they are used to classify the same publication. On this network, we performed overlapping community discovery, i.e. we grouped together sets of classifications present in a set of related publications, allowing classifications to be in different communities at the same time. Instead of obtaining the expected structurless hairball, our community network shows structure. Classifications can be of different types: locations, people, periods, subject themes … . We assigned a color to each type. Then, we characterize each community (and link) with the type of classifications they contain.

We found that there is an uneven and structured distribution of the different types of classifications in communities and clusters of communities (see the above picture: the colors are not randomly placed, click on it to enlarge). We found the first pill to cure our Paestum headache: when you look for it in the global level, you obtain 12 different communities, each one giving you a piece of information of where Paestum is in the landscape of classical archaeology

The meso-level stands in the middle between the papers and the global level. Its function is to provide information about what significantly characterizes a sub-field, in our case the sub-fields and all the other classifications relevant for Paestum. In the meso-level we are interested in putting together a coherent set of classifications that properly describe a sub-field of classical archaeology. To create it, we consider papers as customers “purchasing” classifications at the classification supermarket (remember: each publication is tagged according to its content). We then mine association rules from these purchases. Association rules are a mining tool that efficiently explore all possible significant purchases of the same products by the same customers, with surprising results in the same line of the (urban) legendary beer-diapers correlation. In our case, we end up with a subject theme network where we understand which subject theme is related with which other (in the below picture, the Plastic Art and Sculpture branch, click on it to enlarge).

In this meso-level we can characterize each one of the 12 communities with the sub-fields Paestum is related to: the period of time of the construction of the temples, the Magna Graecia geographical cluster, the fate of ancient monuments (pieces of the temples were used in other buildings), you get the idea. You have the possibility of switching back on the global level, by checking one of the related classifications connected to Paestum in one (or more than one) community and go on virtually to infinity (and beyond). Here’s what Paestum looks like in our system:

Exploring the two layers is lots of fun, because they provide complementary information. By jumping from one to another, you can find interesting and possibly unexplored combinations of classifications. On the one hand, the global level gives you an overview of the sub-fields and where and how the different sub-fields relate to each other, at the price of having a community network, where the single classifications disappeared. On the other hand, the meso-level focuses on the significant connections between single classifications and it highlights a true description of what a sub-field is about, with the caveat that we lack a general picture of where this sub-field is located in classical archaeology. In other words, you can create your own research niche in classical archaeology and be a successful scientist in the field (please acknowledge us if you do).

If you like the pictures and you want to have a clearer idea, you can check out the poster related to the paper, as it has a much higher level of detail, it’s an easier read than the paper itself and it’s a great piece of decoration for your living room.

As said above, science is awesome. When science goes meta and it uses itself to make sense of itself, it’s breathtaking.

Continue Reading

04 December 2012 ~ 0 Comments

Complexity Squared

I decided to give to this blog post an obscure title because today I want to talk about something that in complex network analysis goes under many names, so I did not want to favor any of them. What I am talking about are networks with multiple types of relations in them, the main subject of my PhD Thesis and of a recent article that I published in the World Wide Web Journal. These structures are putting more complexity on top of complex networks, therefore they are complex network squared: hence the fancy blog title.

These networks are referred to in the literature with the following terms:

  • Multidimensional (the term that I use in my thesis);
  • Multirelational;
  • Layered;
  • Interdependent;
  • Multisliced;
  • Multilevel;

and so on and so forth. All these terms refer to the same theoretical object, that is also implemented in many ways. I’ll mention some of them just to sound like the guardian of an obscure cult: labeled multigraphs, hypergraphs, mesostructures and coupling edges.

Despite the confusion that I tried to create with the first paragraphs, the general idea of this line of research is brutally simple: in our everyday life we are not part of only one network. It may look like we are, but when we start thinking harder about our relationships, we realize that we know the people we know for different reasons. This idea is the one behind the fact that every person can belong to different “communities” at the same time, which I already discussed in these pages. But it is deeper than that. It does not only require the more sophisticated, but still traditional, community discovery algorithm that I described in that blog post. It requires a whole new model and mindset.

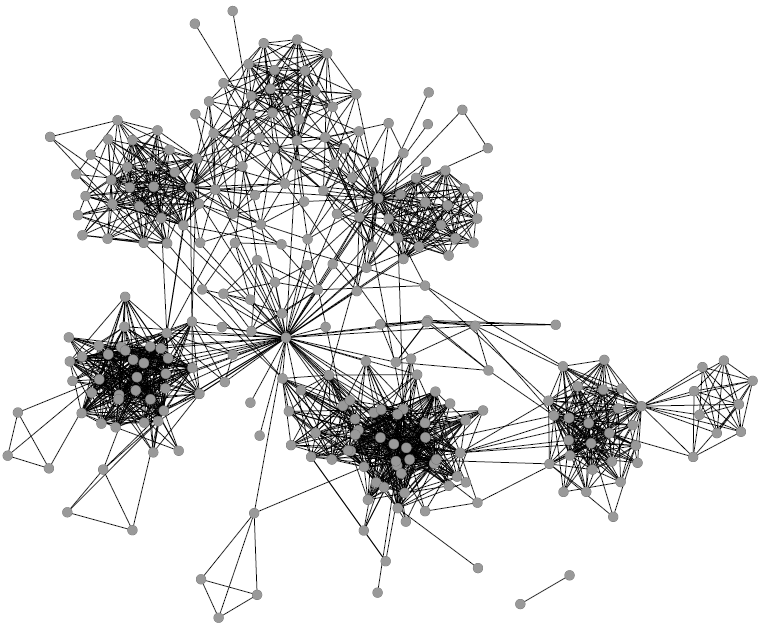
Before multidimensional networks (forgive me if for clarity I’ll use my term for these structures) the classical complex network analyst would just assume that a single relation represents a particular phenomenon and nothing else can be said about it. Allow me to recycle this picture about my Facebook friends:

Intuitively this looks nice, as we can find communities and central nodes. But is this picture really telling us everything about my Facebook friends? What about a higher order of aggregation among them? What about not only their friendship links but also their common interests? The multidimensional network analyst throws a bunch of new connections on top of it and she tells you: “There’s something more”. In this case:

A visualization that is not nearly as elegant as the previous one, I give you that, but nevertheless it is useful to understand a higher level aggregation of my Facebook friends. On top of the connections between friends, we added edges connecting people if they are part of the same group or if they like the same stuff on Facebook. The two gigantic hairballs are composed by people who are in the same location: there is the cluster of people living in Italy, the one of people living in the US, and connections between them from people travelling between the two countries. So, we saw that adding different types of relations uncovers structural properties that none of the relations by itself would reveal.

I’ll give you another example of a cool real world effect of multidimensional networks. This is not from a work of mine, but it is from the Nature paper “Catastrophic cascade of failures in interdependent networks” by  Sergey V. Buldyrev, Roni Parshani, Gerald Paul, H. Eugene Stanley and Shlomo Havlin. Suppose you have a power grid: what happens if one plant is subject to a failure? The classical complex network analyst tells you that we could not care less: the power grid is a scale free network, in which the majority of plants are only connected to a couple other plants. So, a random failure of one plant does not affect the rest of the network too much, unless we are extremely unlucky and we lose a power hub (but that’s really rare, and the classical network guy is an incurable optimist).

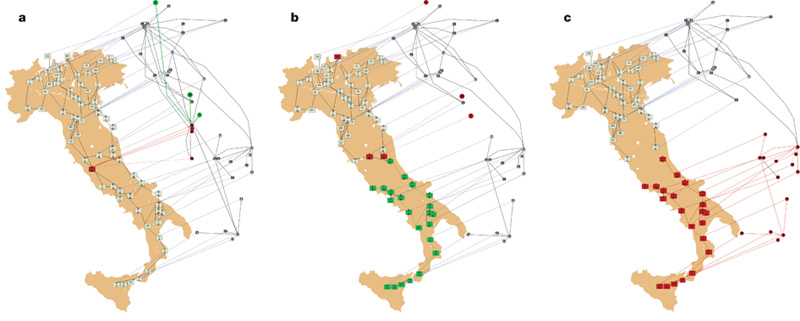
A multidimensional network scientist, instead, is way more careful. Why? Because he knows that the power grid network is not independent from everything else, but it is plugged into another network. For example, in a computer network that regulates its functioning. When a power plant goes down, a set of computers cannot work anymore. And what happen to the plants that are connected to those computers? They fail too, triggering another computer failure and God helps us all. It is theoretically proven that two different scale free relations, dependent on each other, are much much much more fragile than a single scale free network. This actually happened in Italy (where else?) and the following is a depiction from Buldyrev et al’s paper:

In the first Italy we see one plant going down (in red on the map) taking with it the computers it supplies with energy (in the flying network). This triggers a couple more failures in the second picture that eventually, in the third picture, completely destroy the power supply chain of southern Italy.

So far I gave you the idea that multidimensional networks are not exactly the same animal as classical complex networks. To give you a taste of how to prove this, I’ll spare you the super complicated equations of interdependent network percolation present in the Nature paper. I’ll instead provide another example from community discovery. As I said in my previous post, community discovery is loosely defined as the problem of grouping nodes in a network that are “densely connected”. Naturally, when we deal with multidimensional networks, the “densely connected” has to be changed into “multidimensionally densely connected”. Why is this challenging? Here I’ll give you an intuition and I promise that in the future I’ll come back with more details. For now, it is sufficient to use two pictures. Here’s the first:

Here we assume that we have two different dimensions and they are represented with solid or dashed edges. Is this set of nodes multidimensionally dense? Of course: everybody is connected with everybody and all dimensions of the network are equally represented. Now consider another situation:

Is this set of nodes multidimensionally dense? Of course: everybody is connected with everybody and all dimensions of the network are equally represented. But the two examples are very different. That’s funny: we just discovered that, in multidimensional networks, density is an ambiguous concept.

And, as conclusion, I’ll add some multidimensional flavor to another classical network problem: link prediction. Link prediction aims at predicting your next Facebook friend. The above mentioned multidimensional network scientist steps in and says: “But why only your next Facebook friend? Why not your next virtual acquaintance tout-court?”. He means that all your social media connections and their different types play a role in determining when and where you’ll connect with somebody. This is exactly what multidimensional link prediction is, and how to do this is a complex problem that currently remains unsolved. But the multidimensional network guy loves complex problems as much as he loves complex words.

Continue Reading