26 September 2024 ~ 5 Comments

Italian Music through the Lens of Complex Networks

Last year I was talking with a non-Italian, trying to convey to them how nearly the entirety of contemporary Italian music rests on the shoulders of Gianni Maroccolo — and the parts that don’t, should. In an attempt to find a way out of that conversation, they casually asked “wouldn’t it be cool to map out who collaborated with whom, to see whether it is true that Maroccolo is the Italian music Messiah?” That was very successful of them, because they triggered my network scientist brain: I stopped talking, and started thinking about a paper on mapping Italian music as a network and analyzing it.

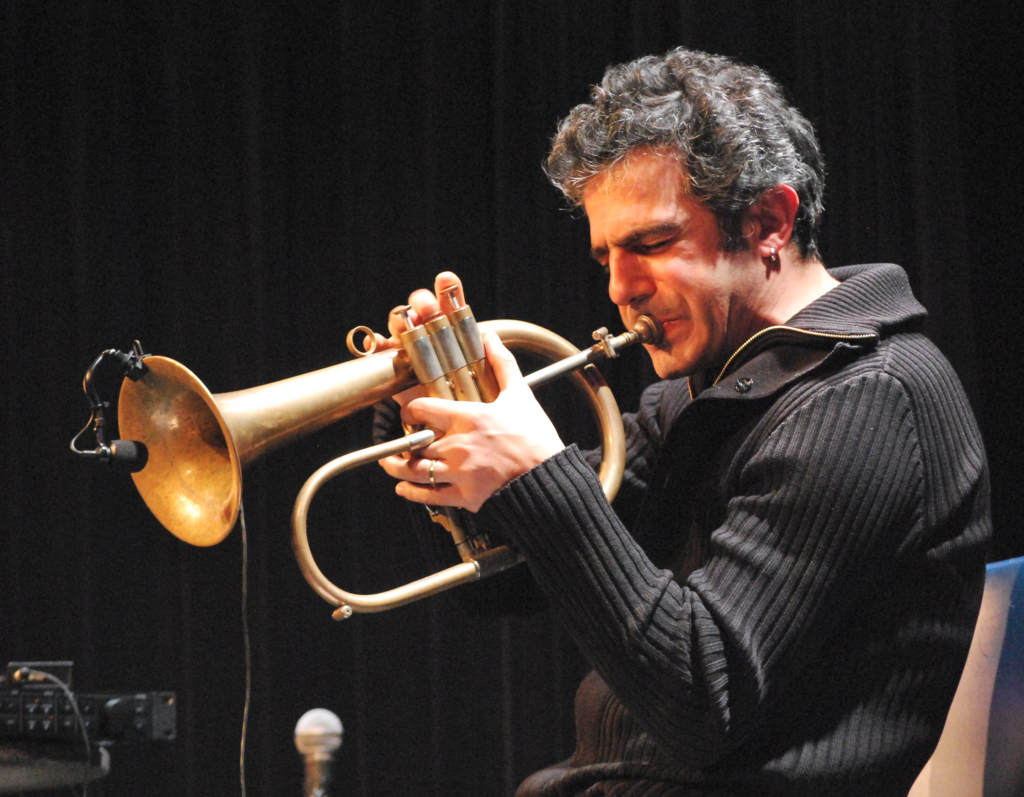
Image credit: bresciaoggi.it

One year later, the paper is published: “Node attribute analysis for cultural data analytics: a case study on Italian XX–XXI century music,” which appeared earlier this month on the journal Applied Network Science.

I spent the best part of last year crawling the Wikipedia and Discogs pages of almost 2,500 Italian bands. I recorded, for each album they released, the lineup of the song players and producers. The result was a bipartite network, connecting artists to the bands they contributed to. I tried to have a broad temporal span, starting from the 1902 of Enrico Caruso — who can be considered the first Italian musician of note (hehe) releasing actual records — until a few of the 2024 records that were coming out as I was building the network — so the last couple of years’ coverage is spotty at best.

Image credit: wikipedia.org

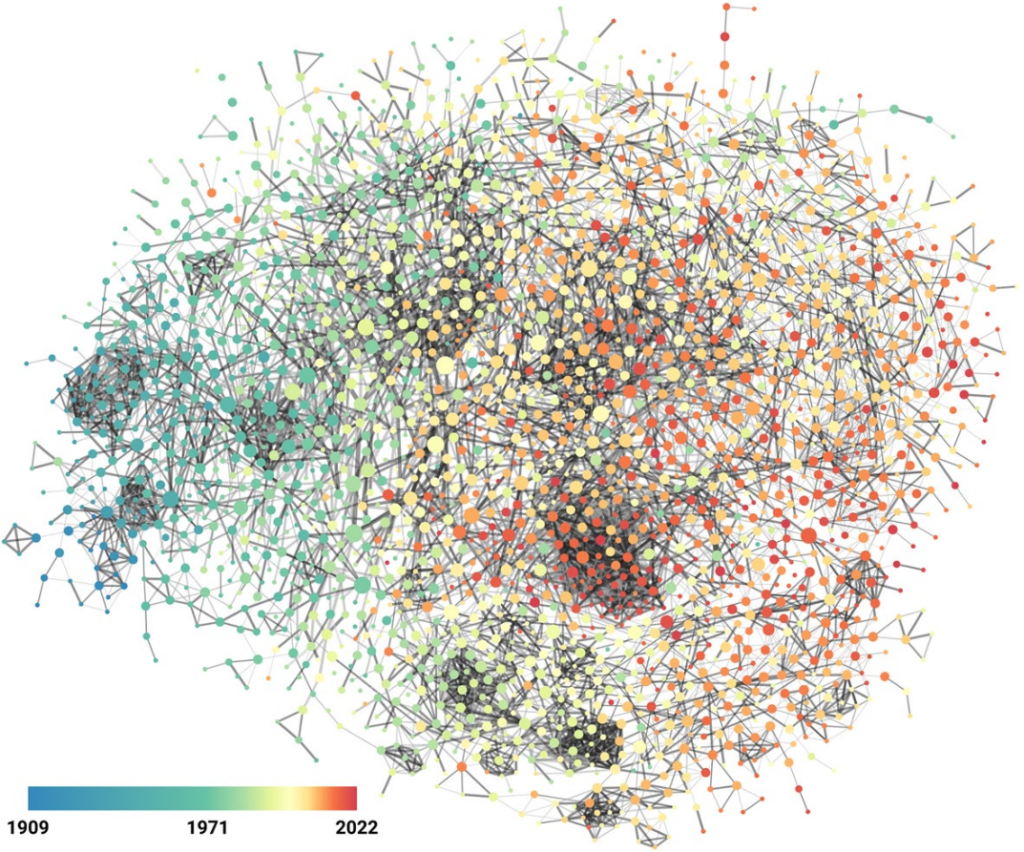
Then I could make two projections of this network. In the first, I connected bands together if they shared a statistically significant number of players over the years. I used my noise corrected backboning here, to account for potential missing data and spurious links.

This is a fascinating structure. It is dominated by temporal proximity, as one would expect — it’s difficult to share players if the bands existed a century apart. This makes a neat left-to-right gradient timeline on the network, which can be exploited to find eras in Italian music production by using my node attribute distance measure:

The temporal dimension: nodes are bands, connected by significant sharing of artists. The node color is the average year of a released record from the band.

You can check the paper for the eras I found. By using network variance you can also figure out which years were the most dynamic, in terms of how structurally different the bands releasing music in those years were:

Network variance (y axis) over the years (x axis). High values in green show times of high dynamism, low values in red show times of structural concentration.

Here we discover that the most dynamic years in Italian music history were from the last half of the 1960s until the first half of the 1980s.

There is another force shaping this network: genre. The big three — pop, rock, electronic — create clear genre areas, with the smaller hip hop living at the intersection of them:

Just like with time, you can use the genre node attributes distances to find a genre clusters, through the lens of how they’re used in Italian music.

What about Maroccolo? To investigate his position, we need to look at the second projection of the artist-band bipartite network: the one where we connect artists because they play in the same bands. Unfortunately, it turns out that Maroccolo is not in the top ten most central nodes in this network. I checked the degree, closeness, and betweenness centralities. The only artist who was present in all three top ten rankings was Paolo Fresu, to whom I will hand over the crown of King of Italian Music.

Image credit: wikipedia.org

Continue Reading

05 March 2024 ~ 0 Comments

My Winter in Cultural Data Analytics

Cultural analytics means using data analysis techniques to understand culture — now or in the past. The aim is to include as many sources as possible: not just text, but also pictures, music, sculptures, performance arts, and everything that makes a culture. This winter I was fairly involved with the cultural analytics group CUDAN in Tallinn, and I wanted to share my experiences.

CUDAN organized the 2023 Cultural Data Analytics Conference, which took place in December 13th to 16th. The event was a fantastic showcase of the diversity and the thriving community that is doing work in the field. Differently than other posts I made about my conference experiences, you don’t have to take my word for its awesomeness, because all the talks were recorded and are available on YouTube. You can find them at the conference page I linked above.

My highlights of the conference were:

  • Alberto Acerbi & Joe Stubbersfield’s telephone game with an LLM. Humans have well-known biases when internalizing stories. In a telephone game, you ask humans to sum up stories, and they will preferably remember some things but not others — for instance, they’re more likely to remember parts of the story that conform to their gender biases. Does ChatGPT do the same? It turns out that it does! (Check out the paper)
  • Olena Mykhailenko’s report on evolving values and political orientations of rural Canadians. Besides being an awesome example of how qualitative analysis can and does fit in cultural analytics, it was also an occasion to be exposed to a worldview that is extremely distant from the one most of the people in the audience are used to. It was a universe-expanding experience at multiple levels!
  • Vejune Zemaityte et al.’s work on the Soviet newsreel production industry. I hardly need to add anything to that (how cool is it to work on Soviet newsreels? Maybe it’s my cinephile soul speaking), but the data itself is fascinating: extremely rich and spanning practically a century, with discernible eras and temporal patterns.
  • Mauro Martino’s AI art exhibit. Mauro is an old friend of mine, and he’s always doing super cool stuff. In this case, he created a movie with Stable Diffusion, recreating the feel of living in Milan without actually using any image from Milan. The movie is being shown in various airports around the world.
  • Chico Camargo & Isabel Sebire made a fantastic analysis of narrative tropes analyzing the network of concepts extracted from TV Tropes (warning: don’t click the link if you want to get anything done today).

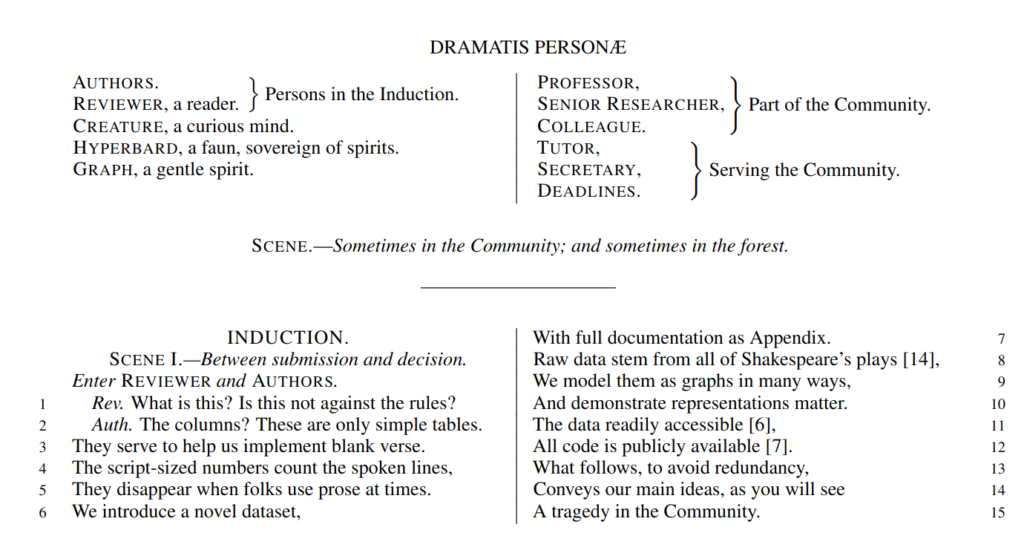
But my absolute favorite can only be: Corinna Coupette et al.’s “All the world’s a (hyper)graph: A data drama”. The presentation is about a relational database on Shakespeare plays, connecting characters according to their co-appearances. The paper describing the database is… well. It is written in the form of a Shakespearean play, with the authors struggling with the reviewers. This is utterly brilliant, bravo! See it for yourself as I cannot make it justice here.

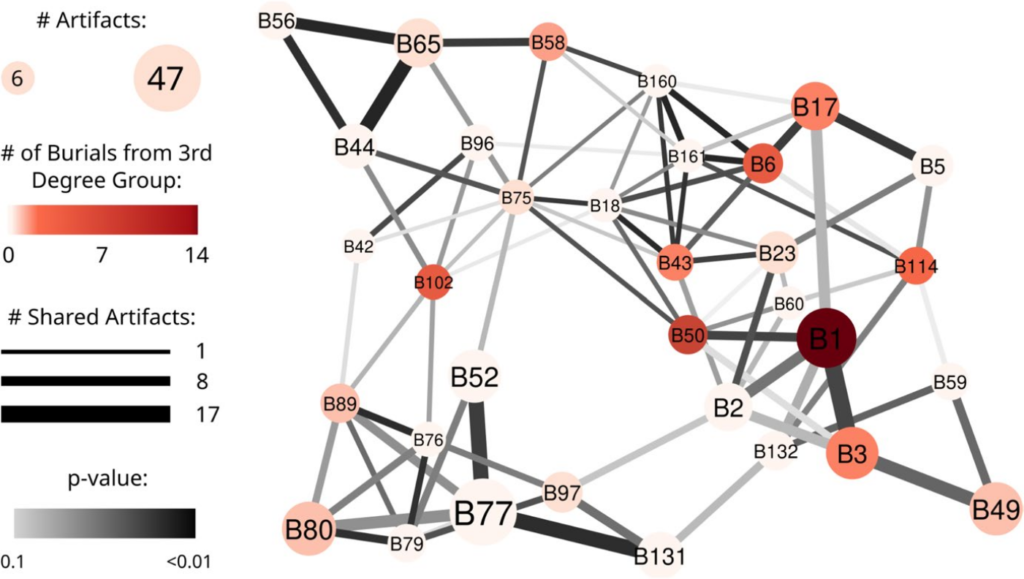
As for myself, I was presenting a work with Camilla Mazzucato on our network analysis of the Turkish Neolithic site of Çatalhöyük. We’re trying to figure out if the material culture we find in buildings — all the various jewels, tools, and other artifacts — tell us anything about the social and biological relationships between the people who lived in those buildings. We can do that because the people at Çatalhöyük used to bury their dead in the foundations of a new building (humans are weird). You can see the presentation here:

After the conference, I was kindly invited to hold a seminar at CUDAN. This was a much longer dive into the kind of things that interest me. Specifically, I focused on how to use my node attribute analysis techniques (node vector distances, Pearson correlations on networks, and more to come) to serve cultural data analytics. You can see the full two hour discussion here:

And that’s about it! Cultural analytics is fun and I look forward to be even more involved in it!

Continue Reading