26 September 2024 ~ 5 Comments

Italian Music through the Lens of Complex Networks

Last year I was talking with a non-Italian, trying to convey to them how nearly the entirety of contemporary Italian music rests on the shoulders of Gianni Maroccolo — and the parts that don’t, should. In an attempt to find a way out of that conversation, they casually asked “wouldn’t it be cool to map out who collaborated with whom, to see whether it is true that Maroccolo is the Italian music Messiah?” That was very successful of them, because they triggered my network scientist brain: I stopped talking, and started thinking about a paper on mapping Italian music as a network and analyzing it.

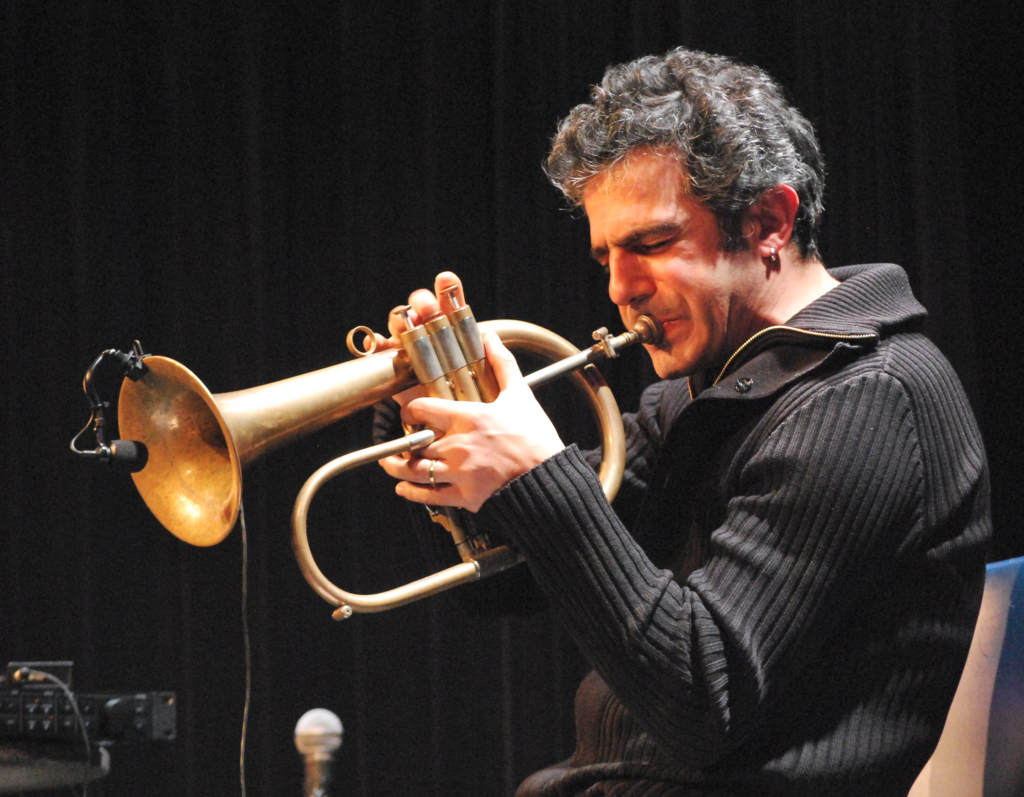
Image credit: bresciaoggi.it

One year later, the paper is published: “Node attribute analysis for cultural data analytics: a case study on Italian XX–XXI century music,” which appeared earlier this month on the journal Applied Network Science.

I spent the best part of last year crawling the Wikipedia and Discogs pages of almost 2,500 Italian bands. I recorded, for each album they released, the lineup of the song players and producers. The result was a bipartite network, connecting artists to the bands they contributed to. I tried to have a broad temporal span, starting from the 1902 of Enrico Caruso — who can be considered the first Italian musician of note (hehe) releasing actual records — until a few of the 2024 records that were coming out as I was building the network — so the last couple of years’ coverage is spotty at best.

Image credit: wikipedia.org

Then I could make two projections of this network. In the first, I connected bands together if they shared a statistically significant number of players over the years. I used my noise corrected backboning here, to account for potential missing data and spurious links.

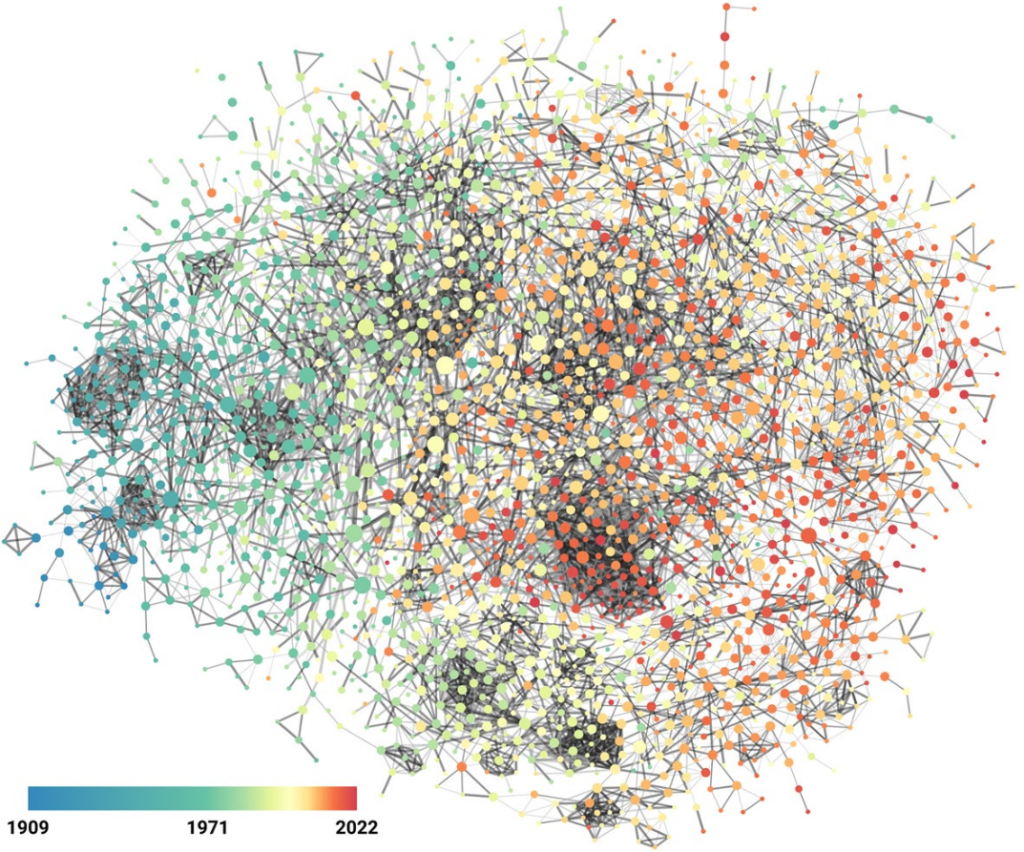
This is a fascinating structure. It is dominated by temporal proximity, as one would expect — it’s difficult to share players if the bands existed a century apart. This makes a neat left-to-right gradient timeline on the network, which can be exploited to find eras in Italian music production by using my node attribute distance measure:

The temporal dimension: nodes are bands, connected by significant sharing of artists. The node color is the average year of a released record from the band.

You can check the paper for the eras I found. By using network variance you can also figure out which years were the most dynamic, in terms of how structurally different the bands releasing music in those years were:

Network variance (y axis) over the years (x axis). High values in green show times of high dynamism, low values in red show times of structural concentration.

Here we discover that the most dynamic years in Italian music history were from the last half of the 1960s until the first half of the 1980s.

There is another force shaping this network: genre. The big three — pop, rock, electronic — create clear genre areas, with the smaller hip hop living at the intersection of them:

Just like with time, you can use the genre node attributes distances to find a genre clusters, through the lens of how they’re used in Italian music.

What about Maroccolo? To investigate his position, we need to look at the second projection of the artist-band bipartite network: the one where we connect artists because they play in the same bands. Unfortunately, it turns out that Maroccolo is not in the top ten most central nodes in this network. I checked the degree, closeness, and betweenness centralities. The only artist who was present in all three top ten rankings was Paolo Fresu, to whom I will hand over the crown of King of Italian Music.

Image credit: wikipedia.org

Continue Reading

27 August 2024 ~ 2 Comments

The Glass Door of Wikipedia’s Notable People

I think Wikipedia is great. I spend tons of time on it. I especially like to read about history, because it allows me to quickly jump into obscure details about anything, without the need to scout for specialized literature that might be super hard to find. But one question always creeps in the back of my mind: am I reading something as fair as it can be? How much are the editors’ biases driving my discovery process? These are testable questions! And the subject of this blog post, and a paper I recently published.

I don’t need this judgemental look when I’m deep in a clicking rabbit hole that started wondering why Brown Noise is called that way…

The paper is “Traces Of Unequal Entry Requirement For Illustrious People On Wikipedia Based On Their Gender” recently published in the Advances in Complex Systems journal. This is mostly the product of brilliant Lea Krivaa‘s master thesis. In the paper, we decided to focus on a specific bias: the role gender plays in the inclusion criteria of notable people on Wikipedia.

The hypothesis is that women need to do more than men to “deserve” a Wikipedia page. The are a few problems with this hypothesis. For starters, we can’t really prove it by simply saying that there are way more men than women on Wikipedia. That can happen and still be fair, because Wikipedia is just working with whatever it can collect from the notoriously male-centric historiography. Moreover, a true fairness test is hard to make: it’s not feasible to collect from the already-biased archives every person’s CV and see that there are discarded CVs from women that are as good as some of the included men on Wikipedia. Good luck checking the Roman Empire CVs after the Visigoths sacked the capital in 410AD.

Gosh darn it, I’m doing the rabbit hole clicking thing again, am I? I’ll never be done writing this article…

However, it turns out that we can find traces of this glass entrance door by using some unexpected network science techniques. We built a network of notable people: we took the set of people from Pantheon, because it’s a curated list of people that are on multiple language Wikipedia editions — this ensures they’re not just a pet peeve of some local editor. Then we connected them with an edge if the page of one person has a hyperlink connecting it to the page of another.

Crucially, we’re able to estimate the weight of the edge with some natural language processing: we count the number of times the target of this hyperlink is mentioned in the page containing the link. Knowing the edge weight is fundamental, because then we can use my backboning method to know the significance of this weight: how likely is it to be a noisy link?

I don’t mean to brag (I do), but I’m quite big in the network backboning industry. Wait, am I on Wikipedia again? Please send help.

Backboning is done to sparsify a network, by dropping the least significant edges. But here we’re just interested in looking at the significance values themselves. By looking at them we discover something odd: the edges involving women are on average more significant. If we were to establish a high significance threshold, we would end up isolating (and dropping) way more men than women. This shouldn’t happen if there was no bias.

On the left we have the distribution of significance for all four types of edges (since it’s a directed network). On the right we have the share of nodes we isolate with a given edge significance threshold. In both cases, you can see women’s edges and nodes are more impervious to harsher significance thresholds.

Our interpretation is that this is a hint that the glass entrance door exist: to be included in multiple language Wikipedias, a woman needs to have more significant ties with other notable people than a man.

This might seem a stretch or a bit abstract, but there’s a neat way to test this interpretation. On March, Wikipedia has a tradition of celebrating the month by improving its coverage of notable women. This means that, in March, it is “easier” for a woman to get added to Wikipedia than normal. And we can confirm this with our analysis! If we only look at pages created in March, the gap we observe is noticeably smaller.

The dark lines (March pages) are closer to each other than the faded ones (all other months).

Of course all of this should be taken with a grain of salt. Since we rely on Pantheon’s curation of profiles, we inherit all of their biases. Moreover, we only focus on the 1750-1950 time period, for various data quality reasons. And there are other factors affecting how much we can read in this analysis. For instance it might be that we simply do not have enough women to include in Wikipedia, because of the male bias in historiography I already mentioned. However, we think this is an interesting question to ask, because we can do better to improve inclusivity. If the gap can shrink in March, we ask: why can’t it shrink the whole year around?

Continue Reading

05 March 2024 ~ 0 Comments

My Winter in Cultural Data Analytics

Cultural analytics means using data analysis techniques to understand culture — now or in the past. The aim is to include as many sources as possible: not just text, but also pictures, music, sculptures, performance arts, and everything that makes a culture. This winter I was fairly involved with the cultural analytics group CUDAN in Tallinn, and I wanted to share my experiences.

CUDAN organized the 2023 Cultural Data Analytics Conference, which took place in December 13th to 16th. The event was a fantastic showcase of the diversity and the thriving community that is doing work in the field. Differently than other posts I made about my conference experiences, you don’t have to take my word for its awesomeness, because all the talks were recorded and are available on YouTube. You can find them at the conference page I linked above.

My highlights of the conference were:

  • Alberto Acerbi & Joe Stubbersfield’s telephone game with an LLM. Humans have well-known biases when internalizing stories. In a telephone game, you ask humans to sum up stories, and they will preferably remember some things but not others — for instance, they’re more likely to remember parts of the story that conform to their gender biases. Does ChatGPT do the same? It turns out that it does! (Check out the paper)
  • Olena Mykhailenko’s report on evolving values and political orientations of rural Canadians. Besides being an awesome example of how qualitative analysis can and does fit in cultural analytics, it was also an occasion to be exposed to a worldview that is extremely distant from the one most of the people in the audience are used to. It was a universe-expanding experience at multiple levels!
  • Vejune Zemaityte et al.’s work on the Soviet newsreel production industry. I hardly need to add anything to that (how cool is it to work on Soviet newsreels? Maybe it’s my cinephile soul speaking), but the data itself is fascinating: extremely rich and spanning practically a century, with discernible eras and temporal patterns.
  • Mauro Martino’s AI art exhibit. Mauro is an old friend of mine, and he’s always doing super cool stuff. In this case, he created a movie with Stable Diffusion, recreating the feel of living in Milan without actually using any image from Milan. The movie is being shown in various airports around the world.
  • Chico Camargo & Isabel Sebire made a fantastic analysis of narrative tropes analyzing the network of concepts extracted from TV Tropes (warning: don’t click the link if you want to get anything done today).

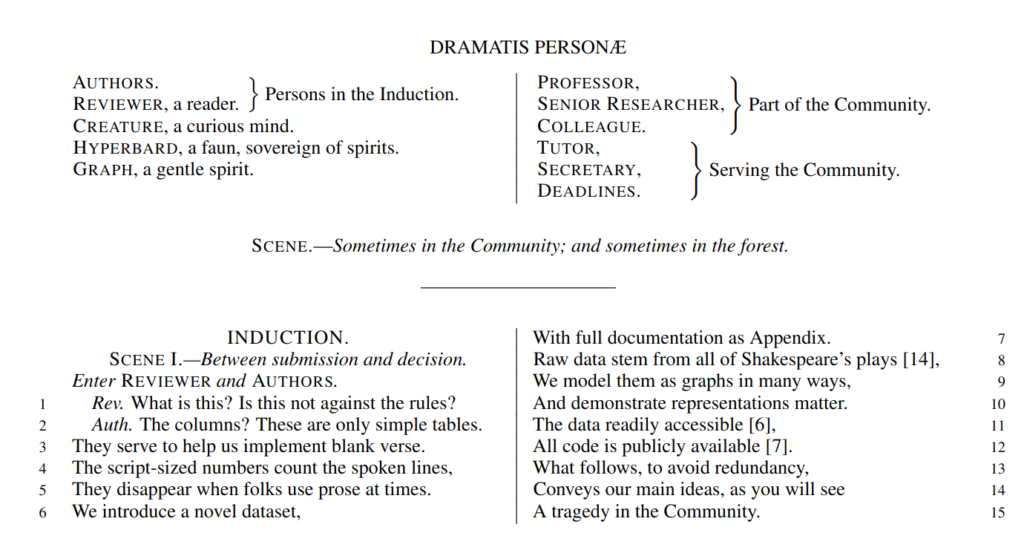
But my absolute favorite can only be: Corinna Coupette et al.’s “All the world’s a (hyper)graph: A data drama”. The presentation is about a relational database on Shakespeare plays, connecting characters according to their co-appearances. The paper describing the database is… well. It is written in the form of a Shakespearean play, with the authors struggling with the reviewers. This is utterly brilliant, bravo! See it for yourself as I cannot make it justice here.

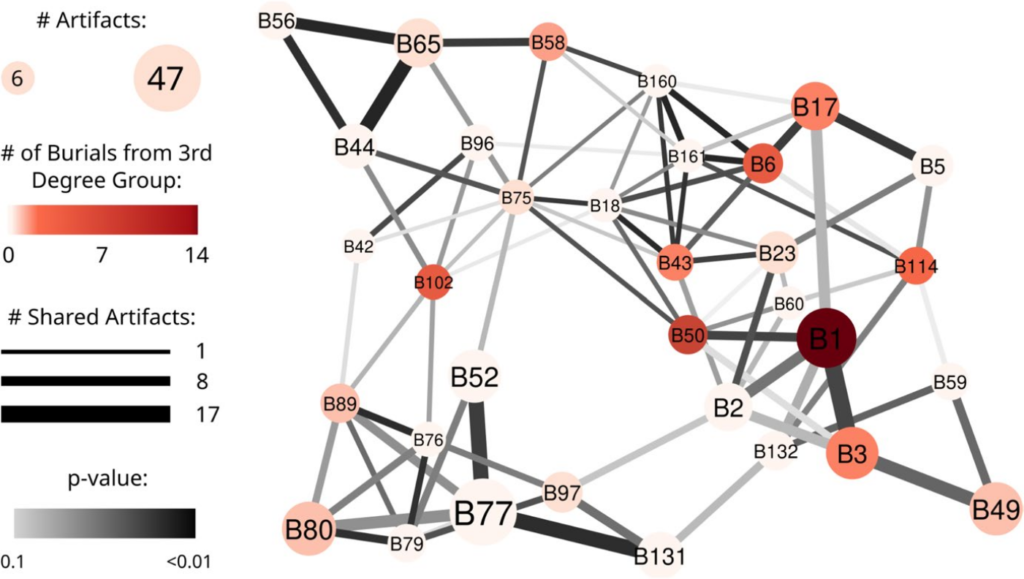
As for myself, I was presenting a work with Camilla Mazzucato on our network analysis of the Turkish Neolithic site of Çatalhöyük. We’re trying to figure out if the material culture we find in buildings — all the various jewels, tools, and other artifacts — tell us anything about the social and biological relationships between the people who lived in those buildings. We can do that because the people at Çatalhöyük used to bury their dead in the foundations of a new building (humans are weird). You can see the presentation here:

After the conference, I was kindly invited to hold a seminar at CUDAN. This was a much longer dive into the kind of things that interest me. Specifically, I focused on how to use my node attribute analysis techniques (node vector distances, Pearson correlations on networks, and more to come) to serve cultural data analytics. You can see the full two hour discussion here:

And that’s about it! Cultural analytics is fun and I look forward to be even more involved in it!

Continue Reading

25 September 2014 ~ 0 Comments

Digital Humanities @ KU: Report

Earlier this month I had the pleasure of being invited to hold a workshop with Isabel Meirelles on complex network visualization and analysis at the Digital Humanities 2014 Forum, held at Kansas University, Lawrence. I figured that this is a good occasion to report on my experience, since it was very interesting and, being quite different from my usual venues, it adds a bit of diversity. The official page of the event is useful to get an overall picture of what was going on. It will be helpful also for everything I will not touch upon in this post.

net_ex19

I think that one of the main highlights of the event was the half of our workshop curated by Isabel, with the additional keynote that she gave. Isabel is extremely skilled both in the know-how and in the know-what about information visualization: she is not only able to create wonderful visualizations, but she also has a powerful critical sense of what works and what doesn’t. I think that the best piece of supporting evidence for this statement is her latest book, which you can find here. As for my part of the workshop, it was focused on a very basic introduction to the simplest metrics of network analysis. You can take a glance at the slides here, but if you are already somewhat proficient in network terminology do not expect your world to be shattered by it.

The other two keynotes were equally fascinating. The first one was from Steven Jones. His talk gravitated around the concept of the eversion of the virtual into reality. Many works of science fiction imagined human beings ending up in some more or less well defined “virtual reality”, where everything is possible as long as you can program it. See for example Gibson’s “Neuromancer”, or “The Matrix”, just to give a popular example that most people would know. But what is happening right now, observes Jones, is exactly the opposite. We see more and more examples of virtual reality elements being introduced, mostly playfully, into reality. Think about qonqr, where team of people have to physically “fight” to keep virtual control of an actual neighborhood. A clever artistic way to depict eversion is also:

The last keynote was from Scott Weingart. Scott is a smart guy and he is particularly interested in studying the history of science. In the (too few!) interactions we had during the forum we touched upon many topics also included in his talk: ethic responsibility of usage of data about people, the influence of the perspective you use to analyze human activities and, a must exchange between a historian of science and yours truly formed as scientist in Pisa, Galileo Galilei. I feel I cannot do justice to his very eloquent and thought-provoking keynote in this narrow space. So I redirect you to its transcript, hosted on Scott’s blog. It’s a good read.

Then, the contributed talks. Among all the papers you can explore from the official forum page, I’d like to focus particularly on two. The first is the Salons project, presented by Melanie Conroy. The idea is to map the cultural exchange happening in Europe during the Enlightenment years. A great role for this exchange was played by Salons, where wealthy people were happy to give intellectuals a place for gathering and discussing. You can find more information on the Salons project page. I liked it because it fits with the idea of knowledge creation and human advancement as a collective process, where an equal contribution is given by both intellect and communication. By basing itself on richly annotated data, projects like these can help us understanding where breakthroughs come from, or to understand that there is no such a thing as a breakthrough, only a progressive interconnection of ideas. Usually, we realize it only after the fact, and that’s why we think it happened all of a sudden.

Another talk I really enjoyed was from Hannah Jacobs. Her talk described a visualization tool to explore the evolution of the concept of “New Woman”, one of the first examples of feminism. I am currently unable to find an online link to the tool. What I liked about it was the seamless way in which different visualizations are used to tell the various points of view on the story. The whole point of information visualization is that when there is too much data to show at the same time, one has to select what to highlight and what to discard. But in this framework, with a wise choice of techniques, one can jump into different magnifying glasses and understand one part of the story of the term “New Woman” at a time.

Many other things were cool, from the usage of the Unity 3D engine to recreate historic view, to the charming visualizations of “Enchanters of Men”. But my time here is up, and I’m left with the hope of being invited also to the 2015 edition of the forum.

Continue Reading