08 March 2023 ~ 0 Comments

Quantifying Ideological Polarization on Social Media

Ideological polarization is the tendency of people to hold more extreme political opinions over time while being isolated from opposing points of view. It is not a situation we would like to get out of hand in our society: if people adopt mutually incompatible worldviews and cannot have a dialogue with those who disagree with them, bad things might happen — violence, for instance. Common wisdom among scientists and laymen alike is that, at least in the US, polarization is on the rise and social media is to blame. There’s a problem with this stance, though: we don’t really have a good measure to quantify ideological polarization.

This motivated Marilena Hohmann and Karel Devriendt to write a paper with me to provide such a measure. The result is “Quantifying ideological polarization on a network using generalized Euclidean distance,” which appeared on Science Advances earlier this month.

The components of our polarization definition, from top to bottom: (a) ideology, (b) dialogue, and (c) ideology-dialogue interplay. The color hue shows the opinion of a node, and its intensity is how strongly the opinion is held.

Our starting point was to stare really hard at the definition of ideological polarization I provided at the beginning of this post. The definition has two parts: stronger separation between opinions held by people and lower level of dialogue between them. If we look at the picture above we can see how these two parts might look. In the first row (a) we show how to quantify a divergence of opinion. Suppose each of us has an opinion from -1 (maximally liberal) to +1 (maximally conservative). The more people cluster in the middle the less polarization there is. But if everyone is at -1 or +1, then we’re in trouble.

The dialogue between parts can be represented as a network (second row, b). A network with no echo chambers has a high level of dialogue. As soon as communities of uniform opinions arise, it is more difficult for a person of a given opinion to hear the other side. This dialogue is doubly difficult if the communities themselves organize in the network as larger echo chambers (third row, c): if all communities talk to each other we have less polarization than if communities only engage with other communities that hold more similar opinions.
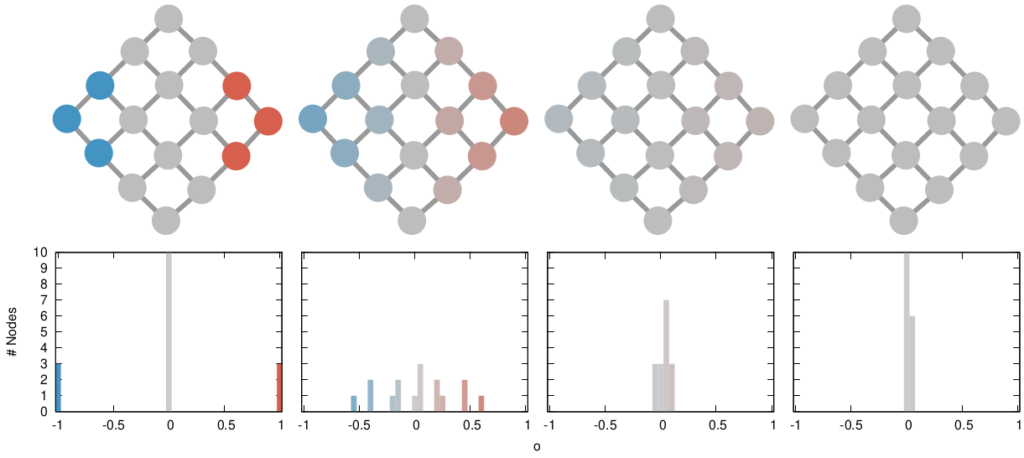
In this image, time flows from left to right: the first column is the initial condition with the node color proportional to its temperature, then we let heat flow through the edges. The plot on the second row shows the temperature distribution of the nodes.

The way we decided to approach the problem was to rely on the dark art spells of Karel, the Linear Algebra Wizard to simulate the process of opinion spreading. In practice, you can think the opinion value of each person to be a certain temperature, as the image above shows. Heat can flow through the connections of the network: if two nodes are at different temperatures they can exchange some heat per unit of time, until they reach an equilibrium. Eventually all nodes converge to the average temperature of the network and no heat can flow any longer.

The amount of time it takes to reach equilibrium is the level of polarization of the network. If we start from more similar opinions and no communities, it takes little to converge because there is no big temperature difference and heat can flow freely. If we have homogeneous communities at very different temperature levels it takes a lot to converge, because only a little heat can flow through the sparse connections between these groups. What I describe is a measure called “generalized Euclidean distance”, something I already wrote about.
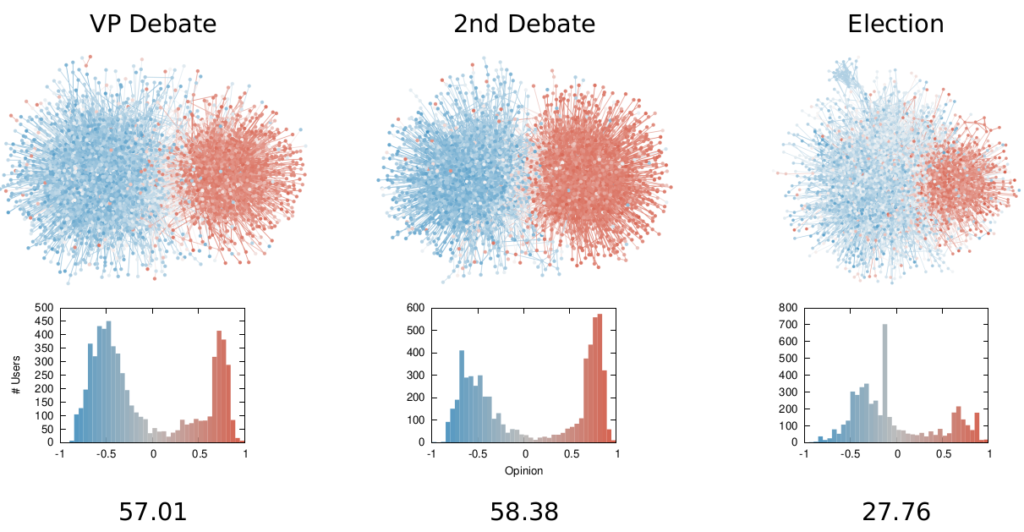
Each node is a Twitter user reacting to debates and the election night. Networks on the top row, opinion distributions in the middle, polarization values at the bottom.

There are many measures scientists have used to quantify polarization. Approaches range from calculating homophily — the tendency of people to connect to the individuals who are most similar to them –, to using random walks, to simulating the spread of opinions as if they were infectious diseases. We find that all methods used so far are blind and/or insensitive to at least one of the parts of the definition of ideological polarization. We did… a lot of tests. The details are in the paper and I will skip them here so as not to transform this blog post into a snoozefest.

Once we were happy with a measure of ideological polarization, we could put it to work. The image above shows the levels of polarization on Twitter during the 2020 US presidential election. We can see that during the debates we had pretty high levels of polarization, with extreme opinions and clear communities. Election night was a bit calmer, due to the fact that a lot of users engaged with the factual information put out by the Associated Press about the results as they were coming out.
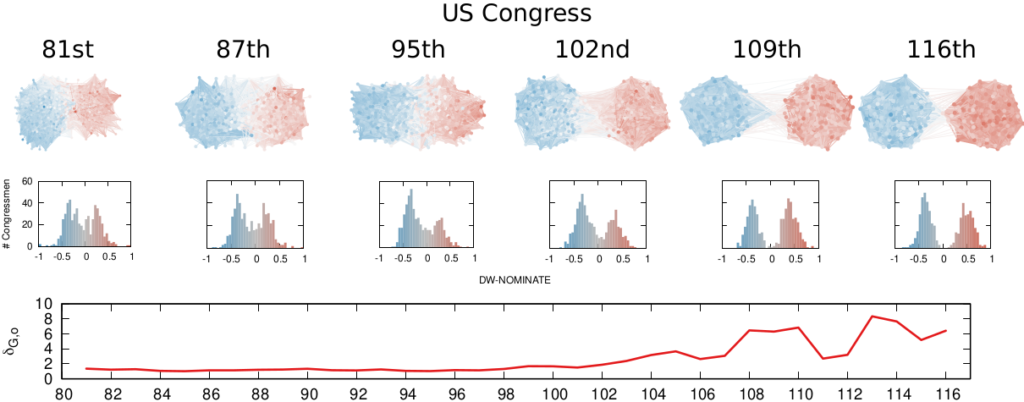
Each node is a congressman. One network per US Congress in the top row, DW-NOMINATE scores distributions in the middle row, and timeline of polarization levels in the bottom.

We are not limited to social media: we can apply our method to any scenario in which we can record the opinions of a set of people and their interactions. The image above shows the result for the US House of Representatives. Over time, congresspeople have drifted farther away in ideology and started voting across party lines less and less. The network connects two congresspeople if they co-voted on the same bill a significant number of times. The most polarized House in US history (until the 116th Congress) was the 113th, characterized by a debt-ceiling crisis following the full application of the Affordable Care Act (Obamacare), the 2014 Russo-Ukrainian conflict, strong debates about immigration reforms, and a controversial escalation of US military action in Syria and Iraq against ISIS.

Of course, our approach has its limitations. In general, it is difficult to compare two polarization scores from two systems if the networks are not built in the same way and the opinions are estimated using different measures. For instance, in our work, we cannot say that Twitter is more polarized than the US Congress (even though it has higher scores), because the edges represent different types of relations (interacting on Twitter vs co-voting on a bill) and the measures of opinions are different.

We feel that having this measure is a step in the right direction, because at least it is more accurate than anything we had so far. All the data and code necessary to verify our claims is available. Most importantly, the method to estimate ideological polarization is included. This means you can use it on your own networks to quantify just how fu**ed we are the healthiness of our current political debates.

Continue Reading

17 August 2022 ~ 0 Comments

Social Media’s Intolerance Death Spiral

We’ve all been on social media for far too long and it’s changed some of us. We started as starry-eyed enthusiasts: “surely the human race will be able recognize when I explain the One True Right Way of Doing Things” — whatever that might be — “so I’ll be nice to everyone as I’m helping them to reach the Light”. But now, when we read about hollow Earths or the Moon not existing for the 42nd time, we think “ugh, not this moron again”. And that’s the best-case scenario: we’ve seen examples of widespread harassment from people who, in principle, would propose philosophies of love and acceptance. It’s a curious effect, so it’s worthwhile to take a step back and ask ourselves: why does it happen?

This is what Camilla Westermann and I asked ourselves during her thesis project, which turned into the paper “A potential mechanism for low tolerance feedback loops in social media flagging systems,” published a couple of months ago on Plos One. We hypothesized there is a systemic issue: social media is structured in a way that leads people to quickly run out of tolerance. This is not a new idea: many people already pointed out that an indifferent algorithm sees “enragement” and thinks “engagement”, and thus it will actively recommend you the things most likely to make you mad, because anger will keep you on the platform.

Source: https://xkcd.com/386/

While likely true, this is an incomplete explanation. Profiting off radicalization doesn’t sound… nice? Thus it might be bad for business on the long run — if people with pitchforks start knocking at the shiny glass door of your social media behemoth. So, virtually all mainstream platforms have put systems into place to limit the spread of inflammatory content: moderation, flagging, and the like. So why isn’t it working? Why is online discourse apparently becoming worse and worse?

Our proposed answer is that these moderation systems — even if implemented in good faith — are the symptom of a haphazard understanding of the problem. To make our case we created a simple Agent-Based Model. In it, people read content shared by their friends and flag it when it is too far away from their worldview. This is regulated by a tolerance parameter: the higher your tolerance, the more ideological distance a news item requires to trigger your flagging finger.

The proportion of flags (y axis) for a given opinion value (x axis). In this instance of the model, everyone has equally low tolerance (0.1).

This is a model I already talked about in the past and its results were pretty bleak. From the picture above you can see that neutral news sources get flagged the most. This is due to the characteristics of real-world social media — echo chambers, confirmation bias, and the like. In the end, we punish content producers for being moderate.

The thing I didn’t say that time was that the model only shows that pattern for low values in the tolerance parameter. For high tolerance, things are pretty ok. So, if everyone started as a starry-eyed optimist, how did we end up with *gestures in the general direction of Twitter*?

Our explanation is made of a simple ingredient: people think they’re right and want to convince others to behave accordingly because it’s Good — “go to church more!”; “use the correct pronouns!” –, so they do whatever they think will achieve that objective.

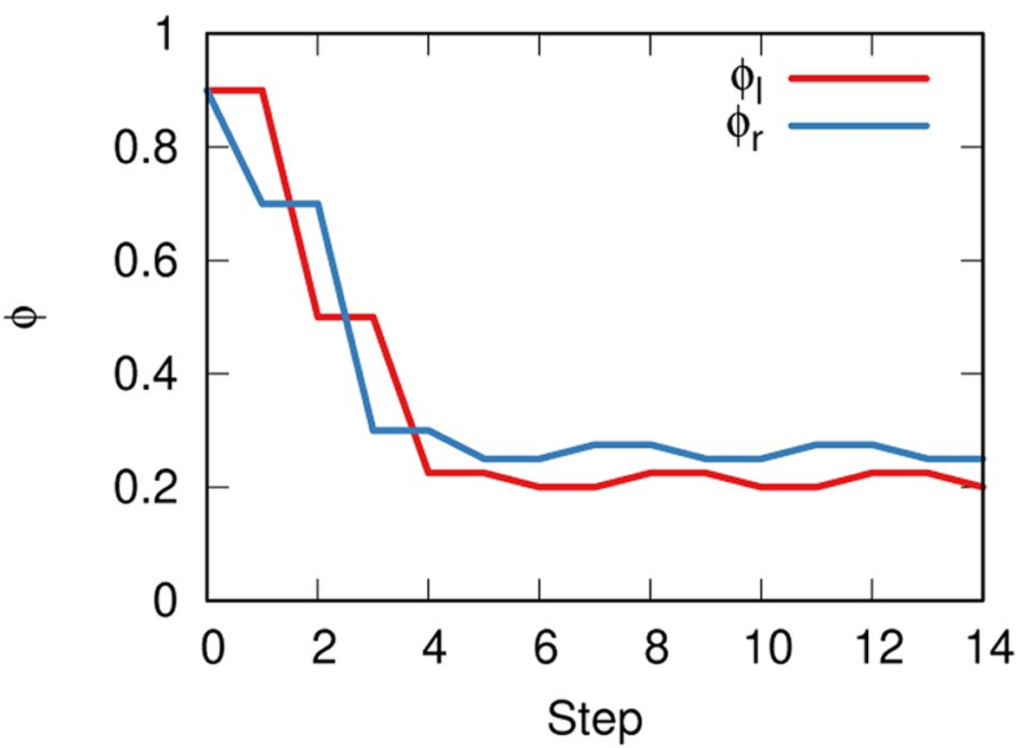
We started the model with the two sides having the same tolerance, set at very high levels, because we are incurable optimists. At each time step, one of the two sides will change their tolerance level. They will search for the tolerance level that will push news sources the most to their side — which, mind you, can also be a higher tolerance level, not necessarily a lower one.

Same interpretation as the previous figure, but here the left side is less tolerant, so the right side gets flagged more. Tolerance is still quite high on both sides (0.8 vs 0.9).

The image above shows that, in the beginning, lowering tolerance is a winnning strategy. The news sources on the more tolerant side get flagged more by the people from the other, less tolerant, side. Since they don’t like being flagged, they are incentivized to find whatever opinion that will minimize the number of flags received — see this other previous work. This happens to pull them to the intolerant side. The problem is that, in our model, no one wants to be a sucker. “If they are attracting people to their side by being intolerant, why can’t I?” is the subconscious mantra we see happening. An intolerance death spiral kicks in, where both sides progressively push the other to even lower tolerance levels, because… it just works.

This happens until the system stabilizes to a relatively low — but non-zero — level of tolerance. Below a certain level, intolerance is so high it doesn’t attract any more. Too low tolerance only repulses, because people would flag you anyway, so what would be the point of moving closer to the intolerant side?

The line shows the tolerance level of two sides (y axis), red and blue, as it evolves when the model runs (x axis).

Of course, this is only the result of a simulation, so it should be taken with the usual boatload of grains of salt. The real world is a much more complex place, with many different dynamics, and humans aren’t blind optimizers of functions[citation needed]. However, it is a simulation using more realistic starting conditions than what social media flagging systems assume, and the low tolerance value for the parameter happens to be extremely close to our best guess estimation of what it is consistent with observed data. So ours might be a guess, but at least it’s decently educated.

What can we take from this research? If you own a social media platform, the advice would be not to implement poorly-thought-out flagging moderation systems: create models with more realistic assumptions (like ours) and use them to guide your solutions. Otherwise, you might be making the problem worse.

And if you’re a regular user? Well, maybe sometimes, being nice is better than making your side win. I’m looking forward to read on Twitter what some people think about this philosophy. I’m sure it will go great.

Continue Reading

28 January 2022 ~ 0 Comments

Avoiding Conflicts on Social Media Might Make Things Worse

Look, I get it. Sometimes you really don’t want to get mired in a Facebook discussion with that uncle of yours who thinks that the moon doesn’t exist. It’s easier to block, unfriend, ignore, rather than engage. However, have you considered that avoiding conflicts might make things worse? This is a question Luca Rossi and I asked ourselves as a part of our research on polarization on social media. Part of the answer comes from an Agent Based Model (ABM) we have recently published on Plos One in the paper “How Minimizing Conflicts Could Lead to Polarization on Social Media: an Agent-Based Model Investigation.”

You sit on a throne of lies.

Specifically, we were interested in looking at how news sources react when they get attacked on social media with backlash and flagging. This is a followup to our previous paper, where we found — surprisingly — that this backlash and flagging is mostly directed at neutral and factual news sources. The reason why these sources are magnets for controversies is because their stories are widely read, and thus attract the ire of all sorts of quacks. Quackery, instead, is only read by quacks agreeing with it, and thus they don’t quack at it so much.

So now the question is: what does this negative attention from quacks do to a neutral news source? To answer the question we updated our ABM. In the original version, each news source and user had a fixed political position — a numerical value between -1 (extreme left) and +1 (extreme right), with 0 as perfect neutrality. In the new version, their position can change. People get attracted by similar points of view and repulsed by opinions that are too far from their position. For instance, a +1 user might get attracted if they read a +0.9 news item (moving to, say, a +0.95 position), but will be repulsed again if they read a -0.5 item next (moving back to, say, a +0.98 position).

Our starting assumption is that users and sources are mostly neutral. Here you can see the initial distributions of how many agents (y axis) have a given opinion (x axis). News sources in red and users in blue.

If a user is repulsed, they will also flag the news source. A news source doesn’t want to be flagged. A flag is a bad omen: too many flags and the news source might get banned by the social media platform, or be subject to big scary fact-checking banners. They might even — gasp! — make Mark Zuckerberg leak a tear. Social media are too important for news sources to let this happen. So they will try to avoid conflict. Since they know flags come from people with a different opinion from their own, the only thing they can do is to change their stance. The safest bet is to average the opinions of all their readers. Taking the average of their neighbors in most cases would lead to settle in the middle of the polarity spectrum, but this is not guaranteed.

One example of the strategy social media have tried to use to combat misinformation online.

Four factors together create the rules of the game: how much users feel the need to share new articles on social media; how tolerant they are with diverse viewpoints; how much news sources will try to resist the pressure to change their spin; and how quickly users change their own opinion following what they read. Having an ABM allows you to run a lot of simulations and see what the effect of each of this aspect is on the final system.

We find that:

  • The more people share, the more news sources will be pushed away from neutrality and become partisan;
  • The less tolerant users are, the more they will increase polarization;
  • The resistance a news organization puts up against such a pressure is irrelevant to the final state of the system;
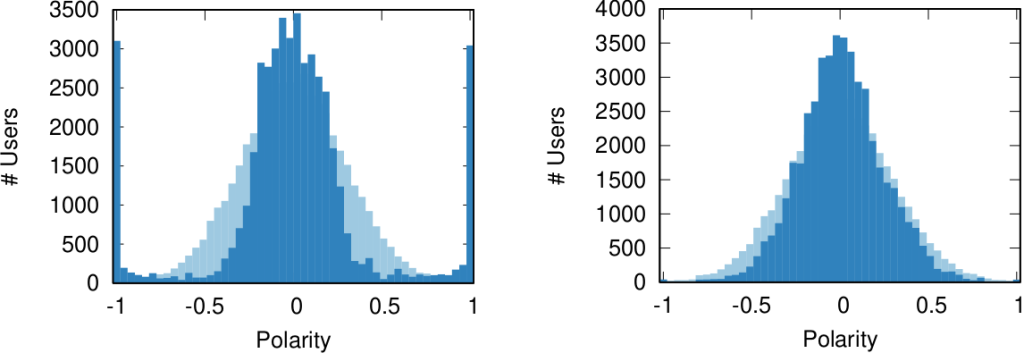
  • If users change their opinions easily, they will be attracted to the extreme ends of the polarity spectrum.
The difference between low tolerance (left) and high tolerance (right) in the opinion distributions of the users after the model has run for a while. Notice the extremist peaks in the left distribution.

Some of this is unsurprising — intolerance breeds polarization –, while other things might be worth looking at a second time. For instance, we think polarization is a bigger deal nowadays exactly because social media helps sharing in a way newspapers, radio, and television do not. Our results say that this oversharing exacerbates polarization. But a nagging question remains: is our ABM just a theoretical toy, or can it reproduce reality?

We think the latter is true, because we tested it against a real world Twitter network. We have a network topology of who talks with whom, and a polarity score for each user based on the news sources they cite in their tweets. The parameter combination that best reproduces real world data is this: high sharing, high opinion volatility, and low tolerance. Which in our model is the exact recipe for escalating conflict. And all of this just because news sources eschew conflict and don’t want to be flagged. Ouch.

This is what happens to the polarity distribution of the users when we try to fit our ABM model on real data from Twitter. Double ouch.

The same grains of salt that you should take our previous paper with also apply here. The model is based on assumptions, and thus it is only as good as those assumptions. Moreover, reality is more complicated than our ABM. For instance, we assume tolerance is uncorrelated with one own political opinion. But what if some political opinions tend to go together with being less tolerant of other points of view? And what if users don’t genuinely flag what they think is outrageous, but make a more strategic use of the flag button to advance their own agenda? These are questions we will explore in further developments of our work.

Continue Reading