09 December 2020 ~ 0 Comments

Speed-Check your Diseases on a Social Network

Back in March I wrote a blog post — and a paper — showing a technique to estimate the distance covered by a propagation event on a network between two moments in time. A propagation event could be the failure of a power grid, a word-of-mouth campaign on social media, or — more topically these days — a disease infecting people in a social network. The limitation of that paper was in taking only a single perspective. However, this problem could be solved in at least a dozen different ways. To give justice to such complexity, I recently co-authored the paper “The Node Vector Distance Problem in Complex Networks” with Andres Gomez, James McNerney, and Frank Neffke. The paper was published this month in the ACM Computing Surveys journal and it’s the main focus of this blog post.

Estimating the spreading speed of something in our normal geographical space is important, but relatively trivial. However, networks are complex spaces. You cannot estimate the speed of COVID by looking at the geographical areas it has covered, because what really connects places is not our physical space, but a complex network of relations among regions. In other words, the places closest to China are not necessarily countries like Mongolia or Nepal — both of which share a border with China — but Iran and Italy, because of the many direct flights connecting them.
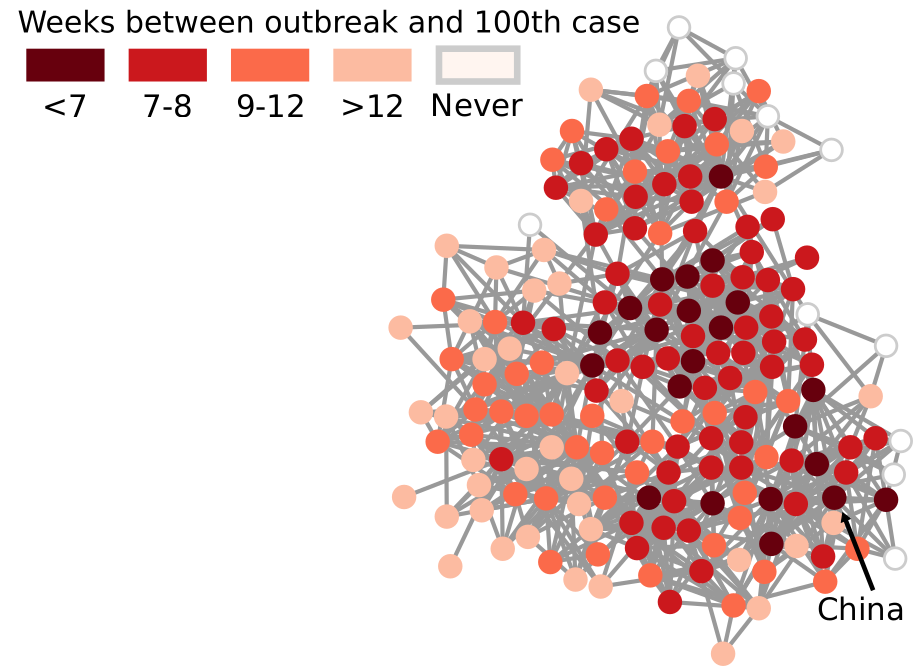
My paper in March found a way to transform our notion of Euclidean distance — a straight line in physical space — to networks. It basically defined what a “straight line” means when all you have is nodes and edges. In the figure above, I connect countries if they have a significant number of direct flights between their airports. Darker nodes represent countries that were hit earlier, and nodes get progressively lighter the later they were first hit. My generalized Euclidean measure allows you to calculate a number describing how fast this process went. This means you could compare it with other pandemics, or you could use it to estimate the moment when a still-developing pandemic will cover a given fraction of the world.

Was mine the only way to translate the concept of “straight line”? No. For starters, it uses an indirect metaphor to define “straightness”. In my generalized Euclidean, every node is a “dimension” of a multidimensional space and, when COVID infects it, it means that the virus had traveled a certain amount of distance in that dimension. If you’re staring dumbfounded at the previous sentence, yeah, that’s pretty much what I expected. A more intuitive way of defining the distance covered in a network would be simply to count how many edges the disease crossed via the calculation of shortest paths.
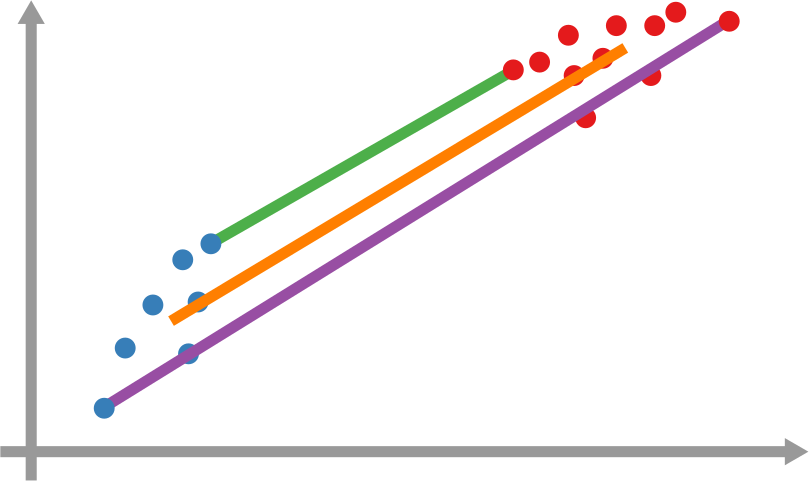
However, it’s still not that easy: how far is each newly infected node from the set of previous infected nodes? And how do we combine all those path lengths into one new measure? In the paper, we explain various ways to do so. One option is to apply linking strategies from hierarchical clustering, as I show in the figure above. The distance between the group of red points from the blue points can be the distance of their closest pair — green line, called single linkage –; the distance of their centers of mass — orange line, average linkage –; or the distance between their farthest pair — purple line, complete linkage. Another option is to simulate an agent optimizing the movement of “packets” from the nodes in the origin to the nodes in the destination — the popular Earth Mover’s Distance measure.

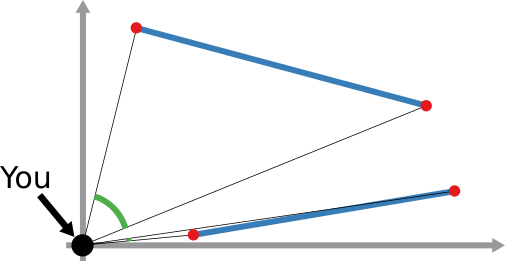
And that still doesn’t cover the space of possibilities! Even in our simple geographical world, we can have different perspectives on what “distance” means. For instance, a popular distance measure is cosine distance. In it, it doesn’t matter how far two points are in the space: if they are on the same line from your point of view, you consider them close together. Now, “distance” becomes the angle by which you have to turn to go from looking straight at one point, to looking at the other. In the figure below, the Euclidean (straight line) distance between two red points is in blue. The cosine distance is the thick green line, showing in the point pair below that it could be quite small even for points that Euclid would say are very far away in the plane. Many measures adopt this distance philosophy for networks, for instance the Mean Markov Chain and the Graph Fourier Transform approaches.
That is more or less where we stop in the paper. I think that there are plenty more network distance measures to be discovered, but the work still needs to be done.

As a companion for the paper, I have developed an open source Python library implementing the majority of network distance measures that we discuss. You can use it to calculate network distances in your data, or to better understand how these measures work. Hopefully, you’ll make my job harder by discovering new measures and forcing me to publish an updated paper on the topic.

Continue Reading

23 January 2018 ~ 0 Comments

Hitting the Front Page Triggers an Evolutionary Arms Race

I’m a conformist. Just like everyone else in computer science working on memes, I am lured by the Holy Grail of questions. Can I figure out what makes content go viral? I really want to answer “yes”, but my absence from Reddit’s front page speaks louder than any advice I could give to you. That didn’t dissuade me from trying to look for a question fitting my preferred answer. After building Earth and waiting a few billion years for it to process the question, this is what I got: “can I figure out what makes content not go viral?” I guess that’s half of the job, right?

In 2014 I proposed my explanation, a rather trivial one: the content that does not go viral is the one that is unoriginal, the one that is too close a copy of something that is already out there. My explanation sounds uncontroversial: to be successful you have to be original, yeah thank you very much. But there was a little problem with it: karma trains. Very often, topics stay popular multiple days: Reddit and social media are flooded with posts about the same thing, seemingly tapping into a neverending pit of attention and upvotes. Unoriginal content actually makes it to the front page. Was it time to throw my theory in the dustbin?* I didn’t think so. So, in this month’s issue of Communications of the ACM, I published a sequel: “Popularity Spikes Hurt Future Chances for Viral Propagation of Protomemes.”

I need to defuse the danger that karma trains represent for my theory, and I do so in two parts, asking two questions. First: is it really true that, in karma trains, content that stays closer to the original post gets more attention and success? Second: is it really true that karma trains contain exclusively unoriginal content? For these questions, I define specifically karma trains to be the collection of posts using a meme after it hit the front page. To answer these questions I focus mainly on Reddit. I use data kindly donated to me by Tim Weninger from the University of Notre Dame (in particular from this paper of his). I look at all catchphrases used frequently — hence the word “protomeme” in the title: my definition is a bit wider than just memes — and I track down how successful they are in each day.

For the first question I have to debunk the notion that unoriginal content is successful in karma trains. First, I check if a meme hit the front page on a particular day. Then I look at all the Reddit posts containing that meme the day after. A karma train implies that more people will use the meme — so, more posts using the catchphrase — and that posts including the meme will be on average more successful. The first part is true: karma trains do exist and, after a meme hits the front page, more people will use it. But the second part is crucially false: on average these posts score poorly. This is not just regression towards the mean: obviously if the meme just hit the front page, its average popularity the day after can only go down. But I control for that. I control for the entire history of the meme. Its average popularity the day after hitting the front page is significantly lower than its regular average popularity, its recent popularity trends, and the average popularity of everything else that day.

So what gives? If the meme is doing poorly, why are karma trains a thing? Because, over those many attempts, a few are going to hit the front page again. Since the front page is very noticeable, we’re tricked into thinking that all posts using the meme are doing well. This transitions nicely into the second part of the paper. Why are those few posts successful? Bell-shaped random distributions teach us that, if you try enough times, one of the attempts is going to be really good. Is that the case? Are we looking at statistical aberrations or is there something interesting? There is: these posts are not ending up on the top randomly. There’s something special about them.

I made up a measure of post originality. Given that a post contains a meme, I want to know if it is repeating it in a boring way, or if it is adding something to the mix. It answers the question: how canonical is the usage of the meme in this post? That is why I called this measure “canonicity”. In practice, for every word that ever appeared in a Reddit title, I calculate the probability that the word is going to be used in a post including that meme. So for every new post I can calculate the average word probability, and ending up with an estimation of how surprising this particular post title is.

You know what I’m going to say next. The more unsuprising a post is, the less likely it is to be successful. A high-canonicity post has roughly half the odds of being widely successful — e.g. hitting the front page — than a low-canonicity one. And the fact that there are low-canonicity posts in karma trains is interesting of itself. It confirms my hunch that, among the posts that jump on the bandwagon of popular memes, there are also original thoughts. This is the evolutionary arms race I mention in the title: when a meme hits the front page, subsequent implementations of it have to constantly innovate, else the meme will be infested by high-canonicity copies, and fade into oblivion. This is generally true for all memes, but it is an effect on steroids for recently successful memes, because they are the ones that are being copied the most in a particular time period.

The story has another interesting turn. Low-canonicity is a double-edged sword. It gives you better odds to hit the front page, but if you fail at it then your performance is going to be atrocious. In that case, high-canonicity posts are actually doing better than low-canonicity ones. In other words, a meme after hitting the front page does a sort of “canonicity sandwich”: the very best AND very worst posts are low-canonicity ones, and in the middle you have high-canonicity posts. Why does this happen? Maybe it’s because of familiarity. Familiar content is reassuring and so people “get it” and upvote. It just does not soar high enough. Or it can be a million other reasons that I haven’t tested yet, so I can only speculate.

What the canonicity sandwich means is that content originality has a varying effect: high canonicity harms you in some cases, but it’s good for you in others. This discovery is important, because other researchers have found that a post’s content doesn’t seem to explain its success very well. The sandwich effect might very well be the cause of our disagreement.

To wrap up, I hope I put on a credible defense of my theory in the face of karma trains. These annoying meme critters are dangerous to my explanation of popularity, because they directly contradict it. Karma trains seems to be a collection of popular unoriginal content: the exact thing my theory says it shouldn’t exist. Upon closer inspection, I noticed that (a) it isn’t really true that karma train posts are particularly successful and (b) it isn’t really true that they only contain unoriginal content. So, my theory is going to die another day, like in all good James Bond flicks**.


* Yes, but I need tenure, so I’ll have to put up a fight.

** Which Die Another Day wasn’t.

Continue Reading