Exploring the Uncharted Export
Exporting goods is great for countries: it is a way to attract foreign currency. Exports are also fairly easy to analyze, since they are put in big crates and physically shipped through borders, where they are usually triple checked*. However, there is another way to attract foreign currency that escapes this analytical convenience. And it is a huge one. Tourism. When tourists get inside your country, you are effectively exporting something: anything that they buy. Finding out exactly what and how much you’re exporting is tricky. Some things are easy: hotels, vacation resorts, and the like. Does that cover all they buy? Probably not.
Investigating this question is what I decided to do with Ricardo Hausmann and Frank Neffke in our new CID Working Paper “Exploring the Uncharted Export: An Analysis of Tourism-Related Foreign Expenditure with International Spend Data“. The paper analyzes tourism with a new and unique dataset. The MasterCard Center for Inclusive Growth endowed us with a data grant, sharing with us anonymized and aggregated transaction data giving us insights about the spend behavior of foreigners inside two countries, Colombia and the Netherlands.
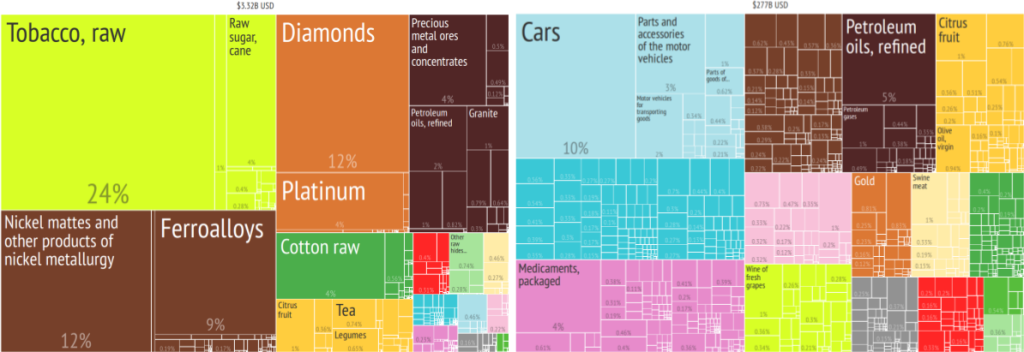
The first thing to clear is the question: does tourism really matter? Tourism might be huge for some countries — Seychelles or Bahamas come to mind** — but does it matter for any other country? Using World Bank estimates — which we’ll see they are probably underestimations — we can draw tourism as the number one export of many countries. Above you see two treemaps (click on them to enlarge) showing the composition of the export basket of Zimbabwe and Spain. The larger the square the more the country makes exporting that product. Tourism would add a square larger than tobacco for Zimbabwe, and twice as big as cars for Spain. Countries make a lot of money out of tourism, so it is crucial to have a more precise way to investigate it.
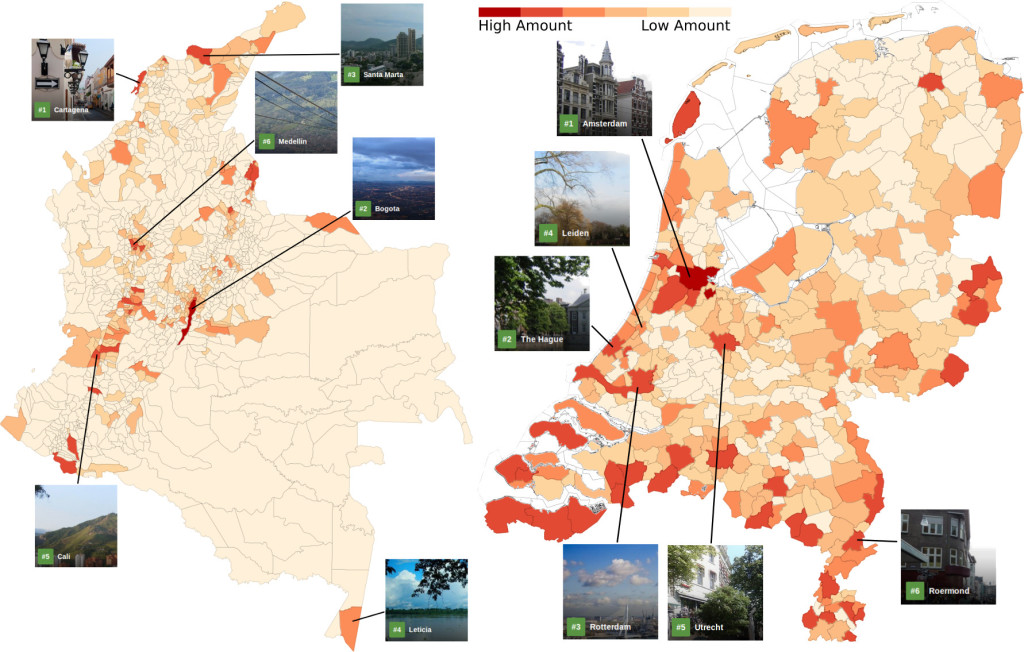
How do we measure tourism? As said before, we’re working with anonymized and aggregated transaction data. In practice, for each postal code of the country of destination we can know how many cards and how much expenditure in total happened in different retail sectors. We focus on cards which were issued outside the country we are analyzing. This way we can be confident we are capturing mostly foreign expenditures. There are many caveats to keep in mind which affect our results: we do not see cash expenditures, we have only a non-random sample from MasterCard cards, and so on. However, when we look at maps showing us the dollar intensity in the various parts of the country (above for Colombia and the Netherlands — click on them to enlarge), we find comforting validation with external data: the top six tourism destinations as reported by Trip Advisor always correspond to areas where we see a lot of activity also in our data.
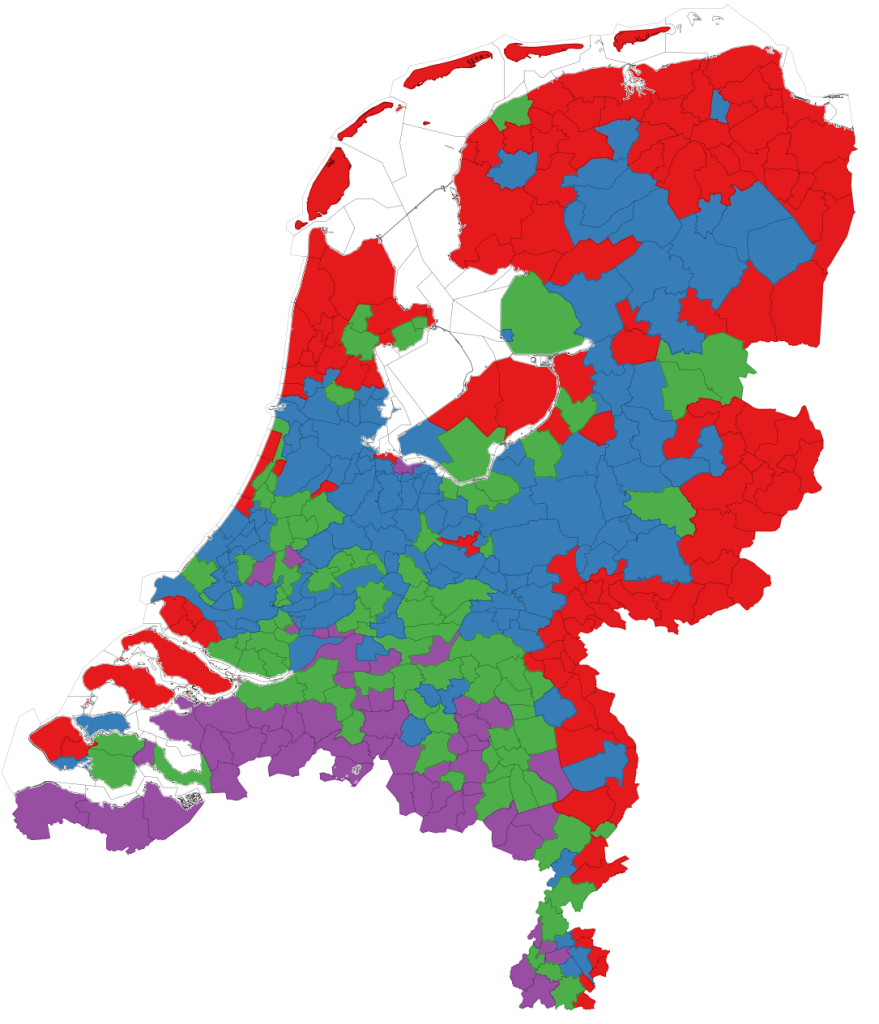
We also see an additional thing, and it turns out to be related to the advantage of our data over traditional tourism reports. A lot is happening on the border. In fact, the second most popular Colombian city after Bogotà is Cucuta. If you never heard of Cucuta it just means that you are not from Colombia, or Venezuela: Cucuta is a city on the northeastern border of the country. It is the place where many Venezuelan cross the border to do shopping, representing a huge influx of cash for Colombia. Until the border got closed, at least (the data is from before this happened, now it’s open again). In the Netherlands, you can cluster municipalities according to the dominant foreign countries observed there — see map above. You will find a Belgian cluster, for instance (in purple). This cluster is dominated by grocery and shopping.
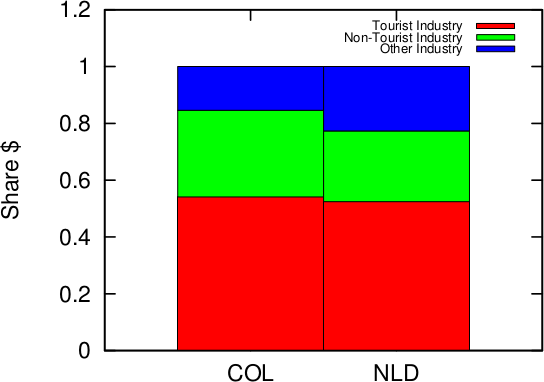
While these Belgian shoppers are probably commuters rather than tourists, they are nevertheless bringing foreign currency to local coffers, so that’s great. And it is something not really captured by alternative methodologies. We classify a merchant type as “commuting” if it is predominant in the purple cluster, because it is more popular for “local” Belgian travelers. Everything else is either “tourism” — if it is predominant in the other non-border municipalities –, or “other” if there is no clear dominance anywhere. In the tourism cluster you find things like “Accommodations” and “Travel Agencies and Tour Operators”; in the commuting cluster you have merchants classified under “Automotive Retail” and “Pet Stores”. When you look at the share of expenditures going to the commuting cluster (above in green), you realize how significant this is. One out of four foreign dollars spent in the Netherlands go to non-tourism related activities. The share for Colombia goes up to 30%.
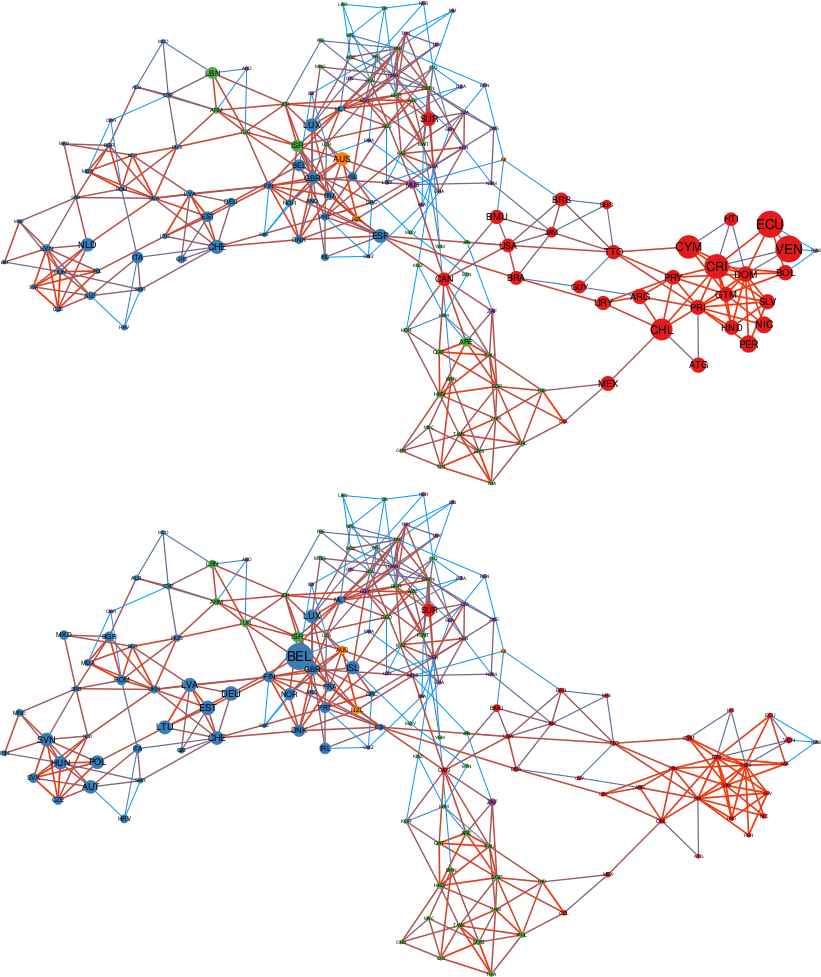
A post in this blog would not be complete without a gratuitous network visualization, so here we are. What you see is what we call “Origin Space” for Colombia (above) and the Netherlands (below). Nodes are countries of origin, and they are connected if the tourists from these countries behave similarly in what and where they make their purchases. The color of the node tells you the continent of the country. The size is the presence of tourists in the country of destination, relative to the origin’s GDP. The size and color of the edge is proportional to how similar the two origins are (orange = very similar; blue = similar, but not so much). We can see that Colombia has a lot of large red nodes — from the Americas — and the Netherlands is strong in blue nodes — from Europe.
If you click on the picture and zoom into the Colombia network you will see why this kind of visualization is useful. Colombia is fairly well-placed in the Australian market: the corresponding node is quite large. A thing then jumps to the eye. Australia has a large and very orange connection. To New Zealand. No surprise: Australians and New Zealanders are similar. Yet, the New Zealand node is much smaller than Australia. It shouldn’t be: these are relative expenditures. This means that, for some reason, Colombia is not currently an appealing destination for New Zealanders, even if it should, based on their similarity with Australians. New Zealand should then be a target of further investigation, which might lead to the untapping of a new potential market for Colombian tourism.
And this concludes the reasons why this data is so amazing to study tourism. To wrap up the message, we have first validated the data, showing that it agrees with what we expect being the most important tourism destinations of a country. Then, we unleashed its potential: the ability to detect “non-tourism” foreign cash inflows, and the promising initial development of tools to discover potential missing opportunities.
* The process is not foolproof, thought. I don’t remember where I read it, but it seems that if you sum all declared exports of countries and all declared imports, and subtract the two, you get a quite high positive number. I wonder where all these extra exports are going. Mars?
** When I was told we were doing a tourism project I got high hopes. I’m still waiting for a fully paid work mission to be approved by management. Any day now.

Thanks for the useful information.