I am one of those people who think about the Roman Empire daily – possibly out of my worrying addiction to Crusader Kings III and similar games. I also spent some time working on estimating economic complexity, a neat measure that can be used to explain economic development trajectories. One fateful day, I was attending a presentation by the excellent Petra Heřmánková when the two thoughts collided in my head like protons in the Large Hadron Collider. Like a data science version of Young Frankenstein, I suddenly realized that we could calculate the Economic Complexity of the Roman Empire and yelled in the middle of her presentation: “It can be done!”1
Well, it could, because we did it: Petra, Matteo Mazzamurro, Tom Brughmans, and I just published “The economic complexity of the Roman Empire as inferred from Latin inscriptions” in the journal npj Complexity. So this blog post is essentially the content of our memoir: “How we did it.”
The eureka moment was when we realized the potential of a splendid dataset: LIST, or Latin Inscriptions in Space and Time. This is the most complete collection to date of Latin inscriptions from the period of the Roman Empire that we know of. For each inscription, we have the coordinates of where it was found, as well as a digital transcription of its text. You can see in the image below a heatmap with the spatial distribution of these inscriptions.
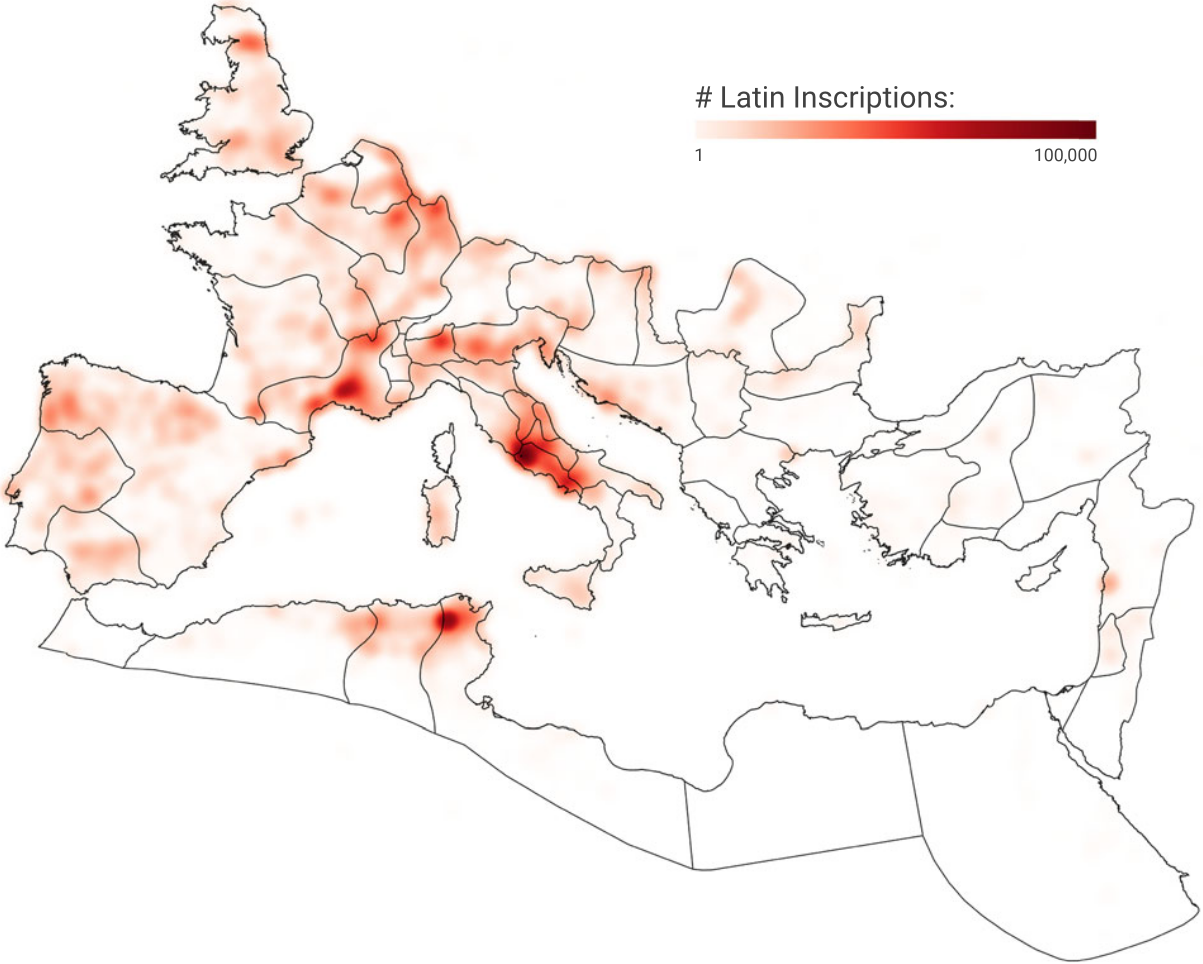
The key to connecting inscriptions to our objective is the same thing that links the economy to everything else: death. Many inscriptions are funerary; others are honorific. All were created with the more or less explicit purpose of saying: “Look at how awesome this guy2 was.” And how else can you boast about someone if not by saying what they actually did? Crucially, this includes their profession, leaving us with evidence of which economic activities – professions – took place where: at the latitude and longitude where the inscription was found.
You can already see why we cannot take this data at face value: if someone is vicariously boasting, they’re going to report only the deceased’s most honorable occupations. This introduces a status bias. That’s not the only bias: these inscriptions are part of the long-honored tradition of ignoring the fact that women exist and do stuff, too. Men outnumber women in the dataset two to one. More bias still: farmers didn’t have the money nor the interest in having inscriptions about themselves, purging from our records probably more than 90% of the workforce. Finally, we can only have the inscription in the dataset if someone found it and bothered digitizing it, which means that we also have a historiography bias.
The bulk of the work on the paper involved Petra researching how to correct for these biases and Matteo implementing analyses that account for them as best we can. The result was an estimate of how many people worked in each occupation in each province of the empire. The heatmap below shows provinces on the y-axis and occupations on the x-axis. Rows and columns are sorted by count, with Latium (Rome) at the top as the province with the most occupations, and farmers on the right as the most common occupation.
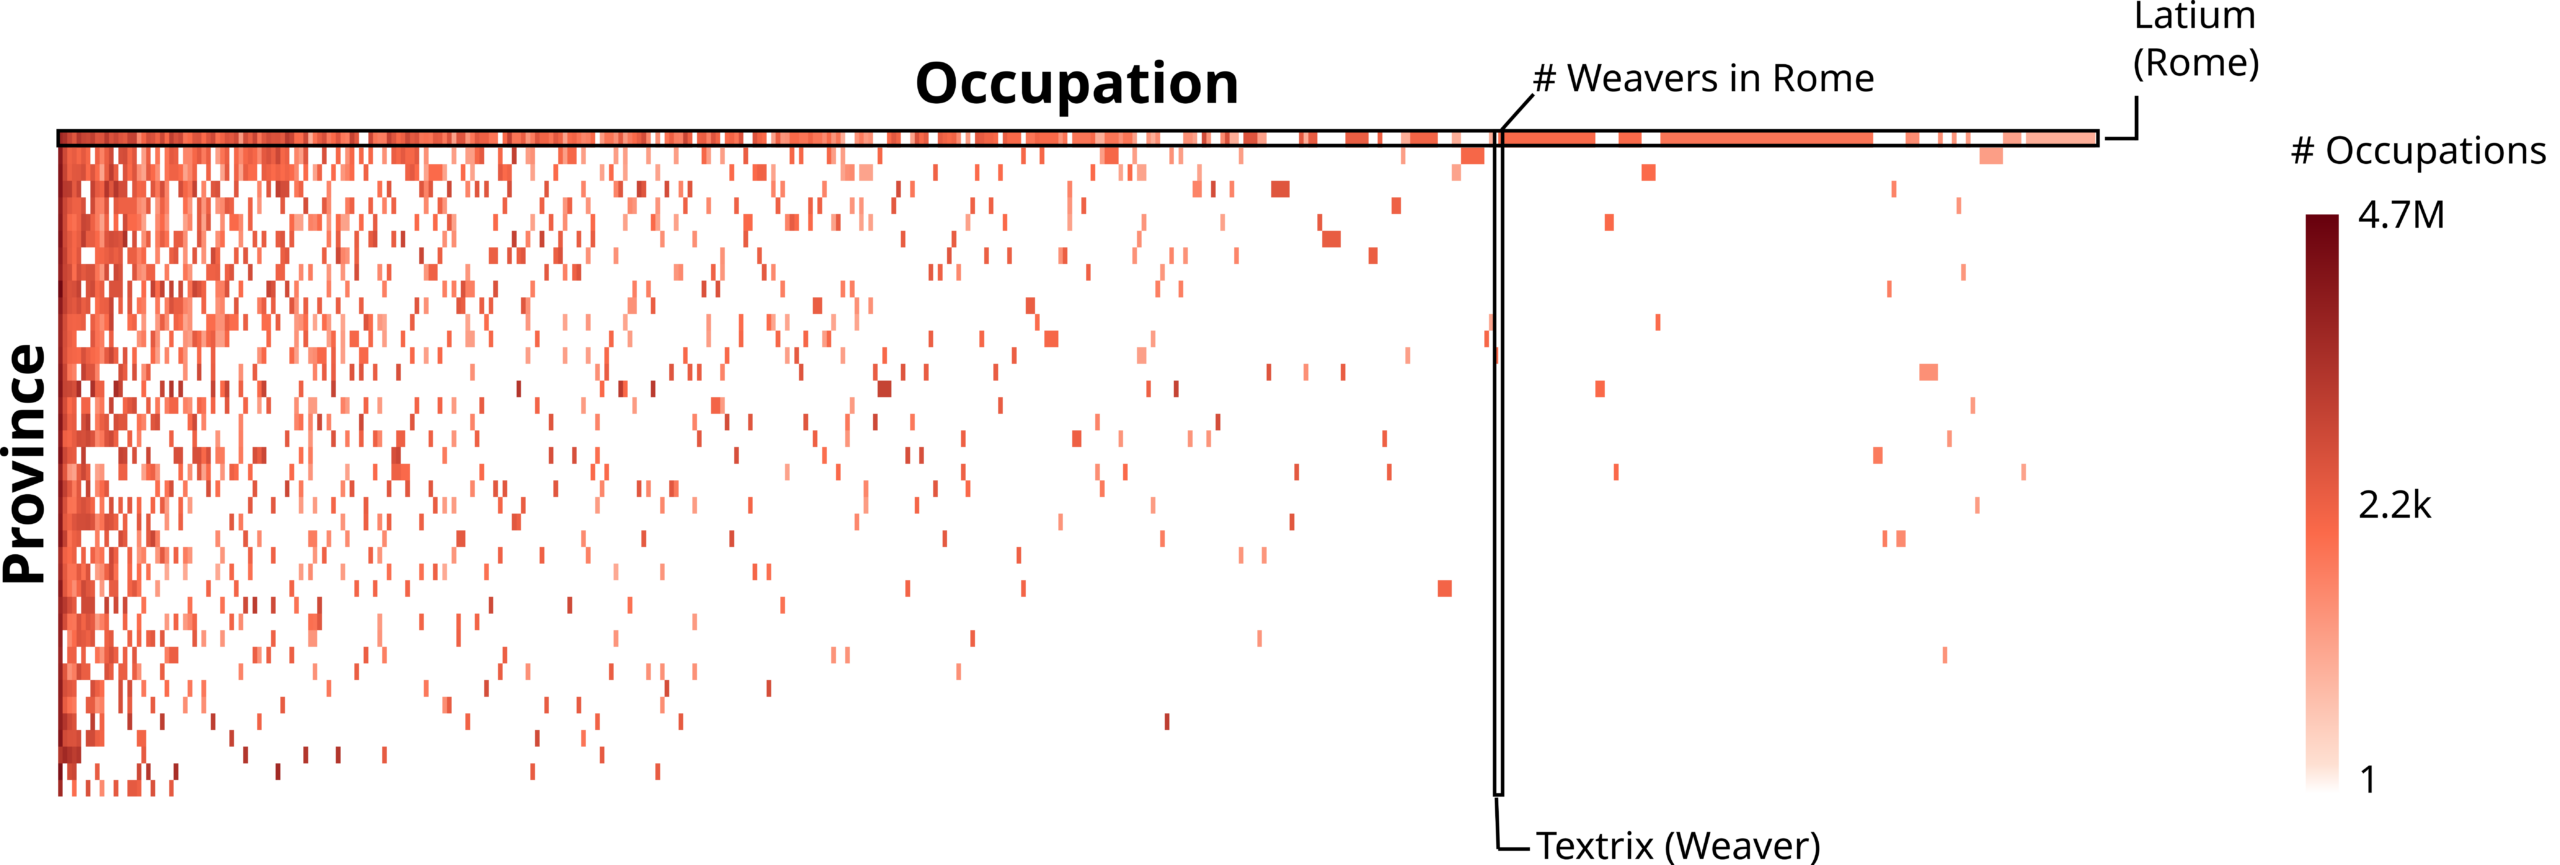
This pattern where most of the stuff happens in the top-left quadrant tingles the spider senses of anyone who has worked on economic complexity. It is a classic nested pattern and a harbinger of things to come. Specifically, the calculation of the Economic Complexity Index (ECI).
It’s hardly surprising that Latium had the highest ECI. More intriguing was the possibility of trying something different. Because the inscriptions have precise latitude and longitude coordinates, we don’t need to use Roman provinces to calculate ECI: any geographical division will do. For instance, we can use the borders of modern countries to calculate an ECI value for the territory that corresponds to modern-day France, but using data from Roman times.
Because I already had estimates of modern-day ECI lying around, it was easy for us to calculate the Spearman rank correlation between today’s ECI values and those obtained using data from the Roman Empire. This is cool because the territory of the Western Roman Empire corresponds to approximately 23 modern-day countries, giving us just about enough observations to test for a significant correlation.
And a significant correlation we found! This is remarkable with only 23 observations and, you know, a millennium and a half gap between the measurements of ECI. It suggests that being complex in the classical era carries a shared signal with being complex today, after a handful of centuries of history. We don’t yet have an explanation for this finding. We cannot establish whether there is a direct causal relationship between the two, or whether some common third factor could explain both. The observation is astounding nonetheless. It is at least consistent with the idea that economic complexity is sticky: our work cannot prove this idea, but we have definitely failed to disprove it.
There is a lot of work left to do. First, we need more and better bias corrections. Second, there is the problematic situationship we have with the Eastern Roman Empire. Those rascals used Greek, not Latin. There is GIST, the sister dataset of LIST, which focuses on Greek inscriptions. Unfortunately, GIST is not up to the required digitization standards yet, and gives off weird results that are more than a simple head-scratcher.
As a third and final action point, I am of the opinion that Carthage must be destroyed.
Splendid contribution.
I like how you try to mitigate bias in all its varieties.
Still, is more ECI in the present not also a factor for discovering inscriptions in the first place? Its hard to correct for, since this is also you big independent variable. Or is this corrected in “researcher bias”?
Yes, that’s our objective with the researcher bias. It’s also not even just about wealth directly: it’s easier to excavate in the Netherlands or Germany than it is in Syria or Palestine simply because of the geopolitical situation, which in turn affects ECI.
“And a significant correlation we found! This is remarkable with only 23 observations and, you know, a millennium and a half gap between the measurements of ECI. It suggests that being complex in the classical era carries a shared signal with being complex today, after a handful of centuries of history. We don’t yet have an explanation for this finding. ”
ECI is probably correlated with cities. – It is actually I’m sure correlated with money which is the correlated with cities. And Cities are on the world map where they are because they have certain geographic features since antiquity that made them favorable locations to put a City. First is lots of fresh water, a river is good for that. Second a way of getting lots of food in to feed all those people, a harbor is good for that, hey look Rome has both. As do many other cities modern and ancient. With modern tech we can put cities in more desert areas, but those are modern, the ancients didn’t do that so much, well except for Rome which found it easier to move fresh water than to move harbors.
I won’t pretend I’m good enough in economics to argue for or against the effect of cities you propose. Still, this is interesting food for thought for the future. With technical advances, as you say, we’re less constrained by geography, so one could ask: at which point would this become uncorrelated with the past, if ever?
credo l’abbiano gia’ distrutta
“being complex in the classical era carries a shared signal with being complex today” – any notable example not following the signal ? (apart Cartago)
There are a couple of examples in the paper going against the grain. Algeria for instance was more complex in the past than it is now (I bet it has something to do with France). The other way around is England and Austria, which in imperial times were lagging behind, but then the following few centuries of history have made them flourish.